Fig. 9.
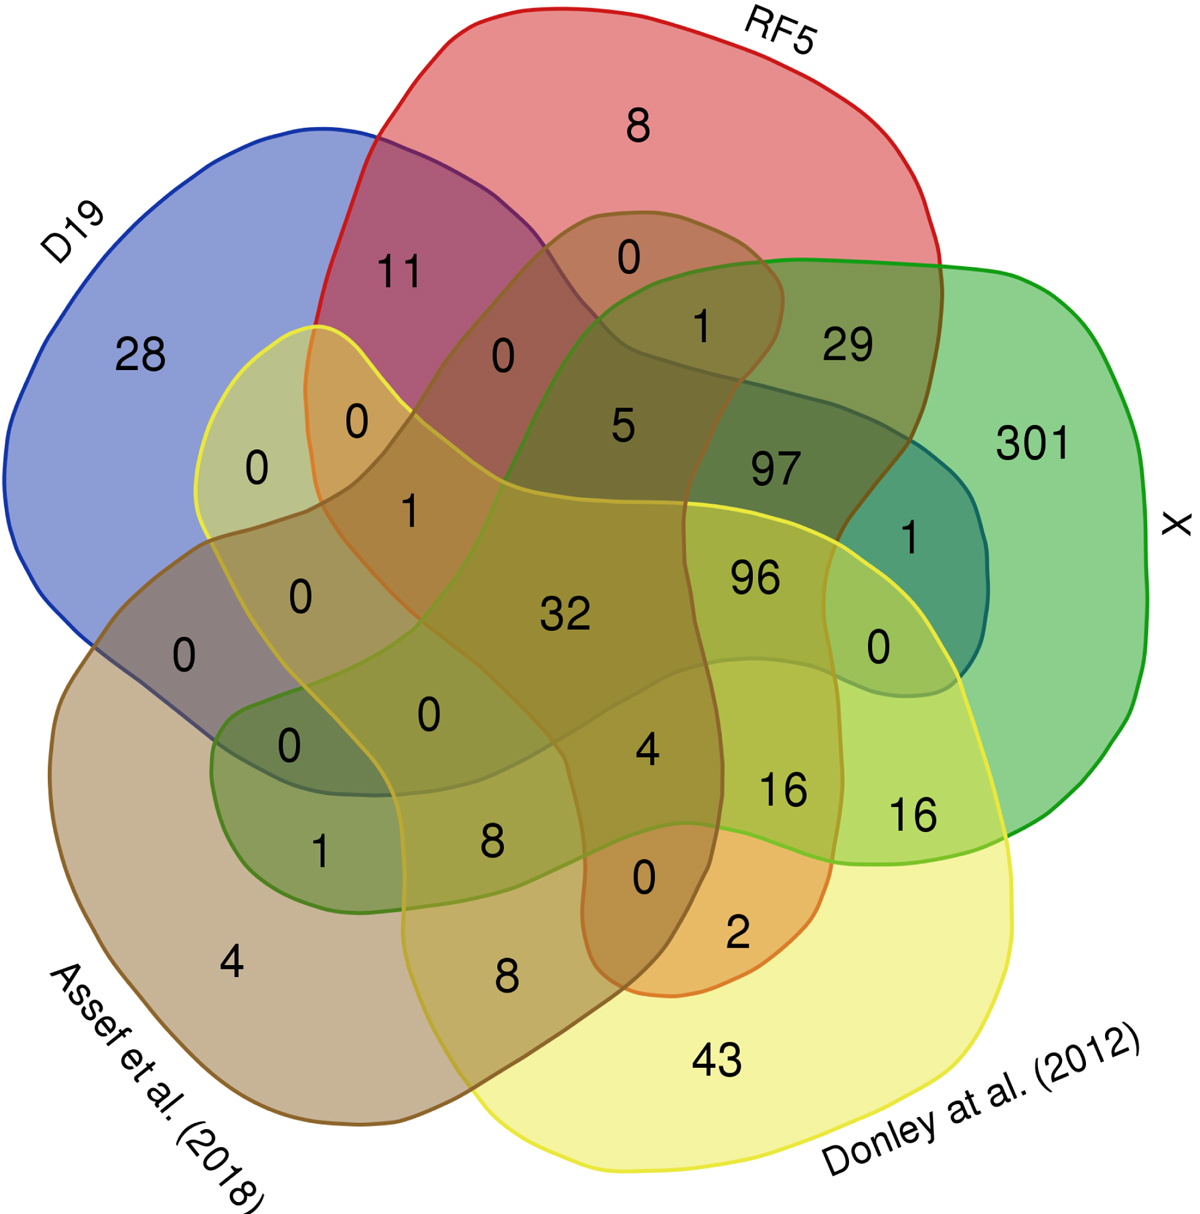
Venn diagram showing: the sample of AGN candidates returned by the RF5 classifier (RF); the sample of AGN candidates from D19; the VST sources in the X-ray sample classified as AGN on the basis of the X/O diagram (X); the VST sources in the main sample classified as AGN on the basis of the MIR diagnostic from Donley et al. (2012); and the VST sources in the main sample classified as AGN on the basis of the criterion defined in Assef et al. (2018). We caution that the area covered by each region is not related to the number of sources in that region. This diagram was rendered via http://bioinformatics.psb.ugent.be/webtools/Venn/.
Current usage metrics show cumulative count of Article Views (full-text article views including HTML views, PDF and ePub downloads, according to the available data) and Abstracts Views on Vision4Press platform.
Data correspond to usage on the plateform after 2015. The current usage metrics is available 48-96 hours after online publication and is updated daily on week days.
Initial download of the metrics may take a while.