Fig. 8.
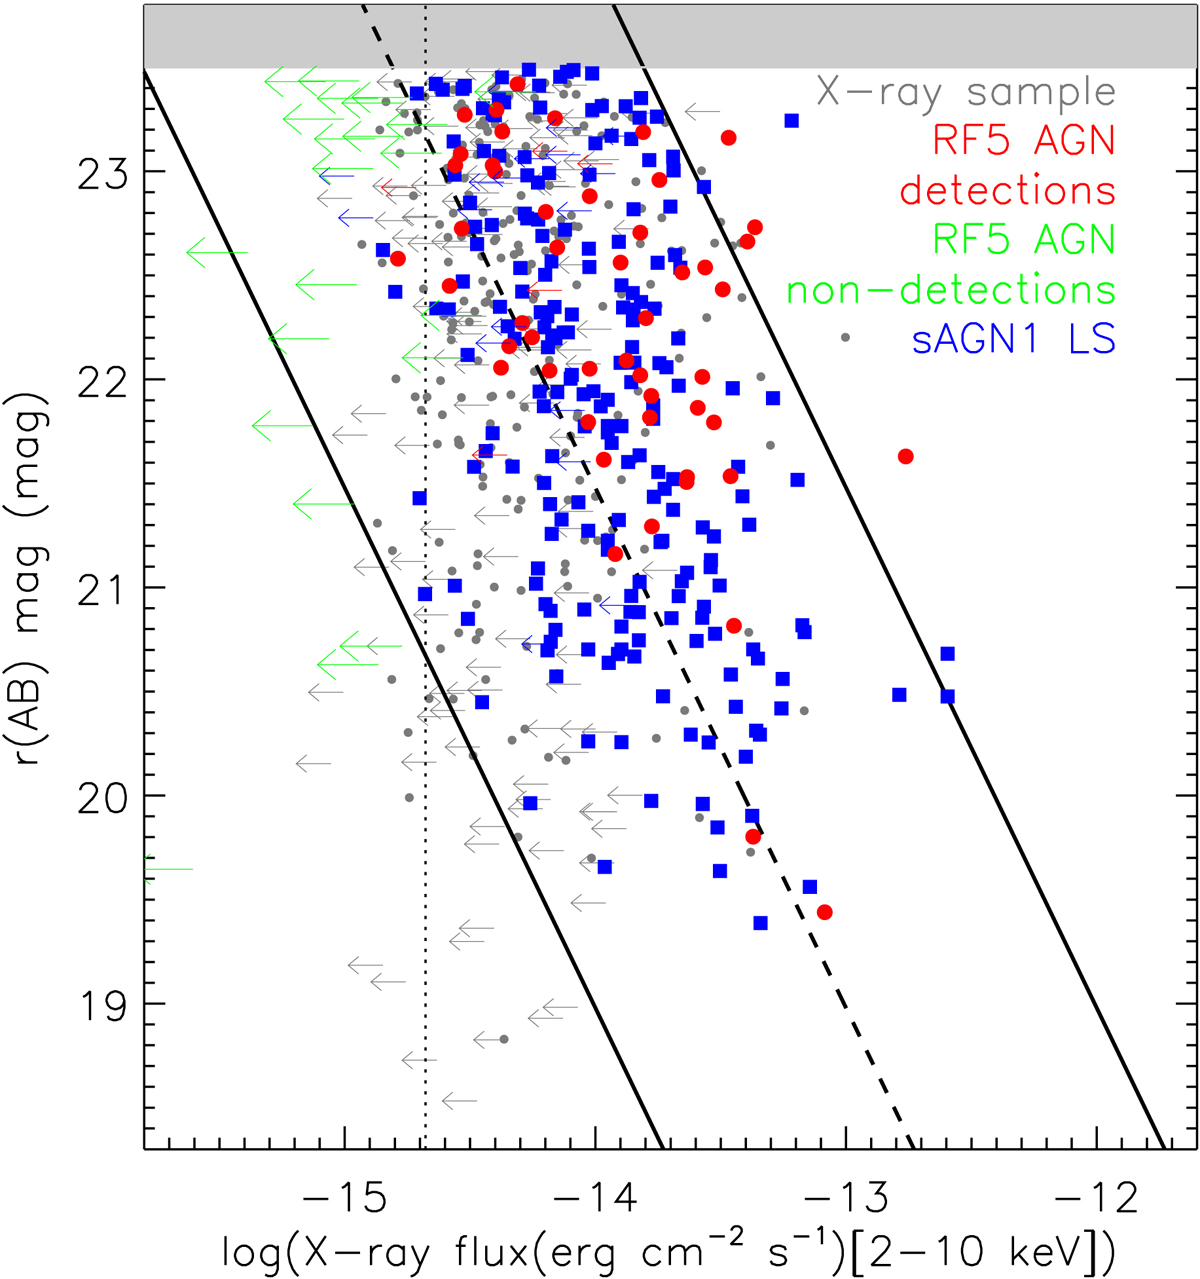
Comparison of X-ray to optical flux for several discussed samples: 55 X-ray detected (large red dots and arrows) and 22 X-ray undetected (large green arrows) sources in the RF5 AGN sample; 225 sAGN1 in the LS (blue squares and arrows); entire X-ray sample (i.e., all the VST sources with X-ray counterparts, gray dots and arrows), shown as a reference. Small leftward arrows denote VST-COSMOS sources which are detected in the Chandra-COSMOS Legacy Catalog but only have 2−10 keV flux upper limits, while large green arrows denote the 22 RF5 AGN candidates which remain undetected in any X-ray band. For the 22 X-ray undetected sources, hard-band X-ray flux limits are estimated using CSTACK (Miyaji et al. 2008). The dashed line indicates X/O = 0, while the lower and upper solid lines correspond to X/O = −1 and X/O = 1, respectively, delimiting the traditional AGN locus. The vertical dotted line indicates the nominal hard-band flux limit of 2.1 × 10⁻¹⁵ erg cm−2 s−1 of the Chandra-COSMOS Legacy Catalog, estimated at 20% of the area of the whole survey. The gray-shaded rectangle indicates that we do not find sources in that area as we set a magnitude limit of 23.5 mag for the VST-COSMOS dataset.
Current usage metrics show cumulative count of Article Views (full-text article views including HTML views, PDF and ePub downloads, according to the available data) and Abstracts Views on Vision4Press platform.
Data correspond to usage on the plateform after 2015. The current usage metrics is available 48-96 hours after online publication and is updated daily on week days.
Initial download of the metrics may take a while.