Fig. 3.
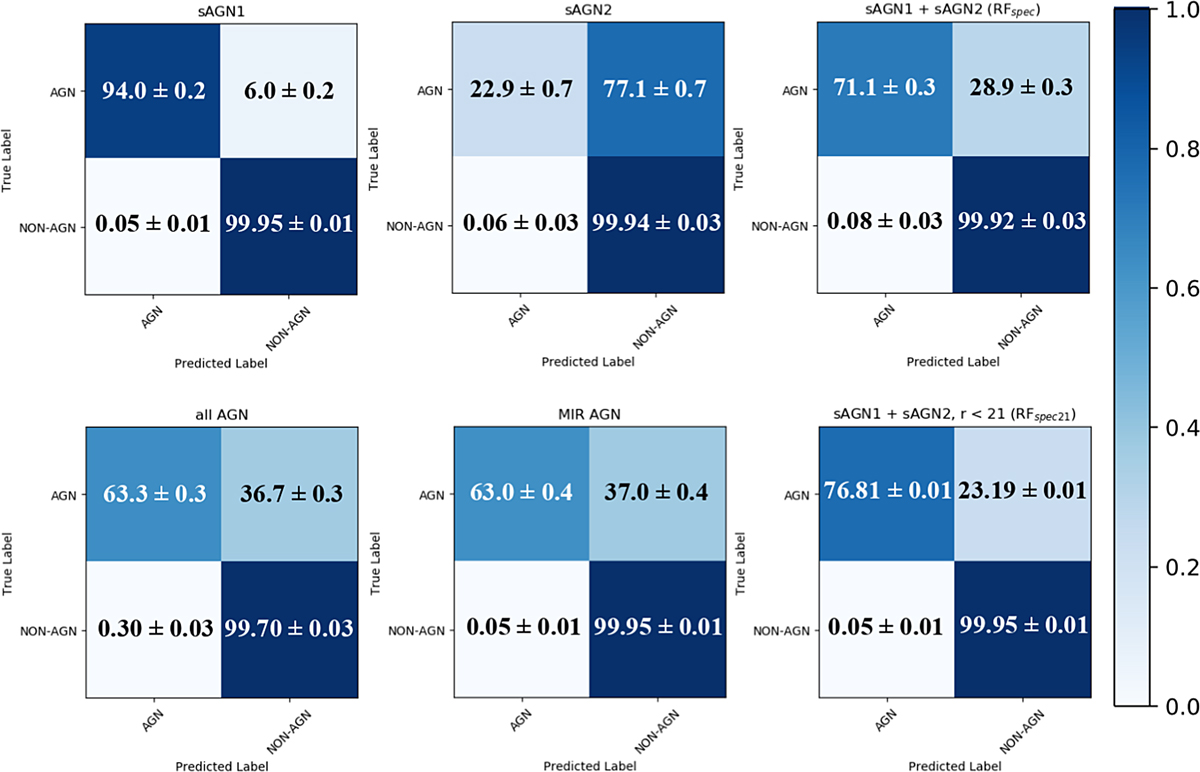
Percent values for the confusion matrices obtained from the classification of different subsamples of AGN in the LS for each test: only sAGN1 (upper left); only sAGN2 (upper center); sAGN1 plus sAGN2 (upper right); sAGN1, sAGN2, and Donley non-sAGN (lower left); MIR AGN (lower center); sAGN1 plus sAGN2, with r ≤ 21 mag (lower right). True Label is the one we used to include the sources in the LS, as detailed in Sect. 2.5. Predicted Label is the outcome of the classification. Each percent error is the standard deviation from the average value obtained from a set of ten simulations per classifier, where each classifier builds each time 500 trees in order to determine the final classification for each source.
Current usage metrics show cumulative count of Article Views (full-text article views including HTML views, PDF and ePub downloads, according to the available data) and Abstracts Views on Vision4Press platform.
Data correspond to usage on the plateform after 2015. The current usage metrics is available 48-96 hours after online publication and is updated daily on week days.
Initial download of the metrics may take a while.