Fig. 8
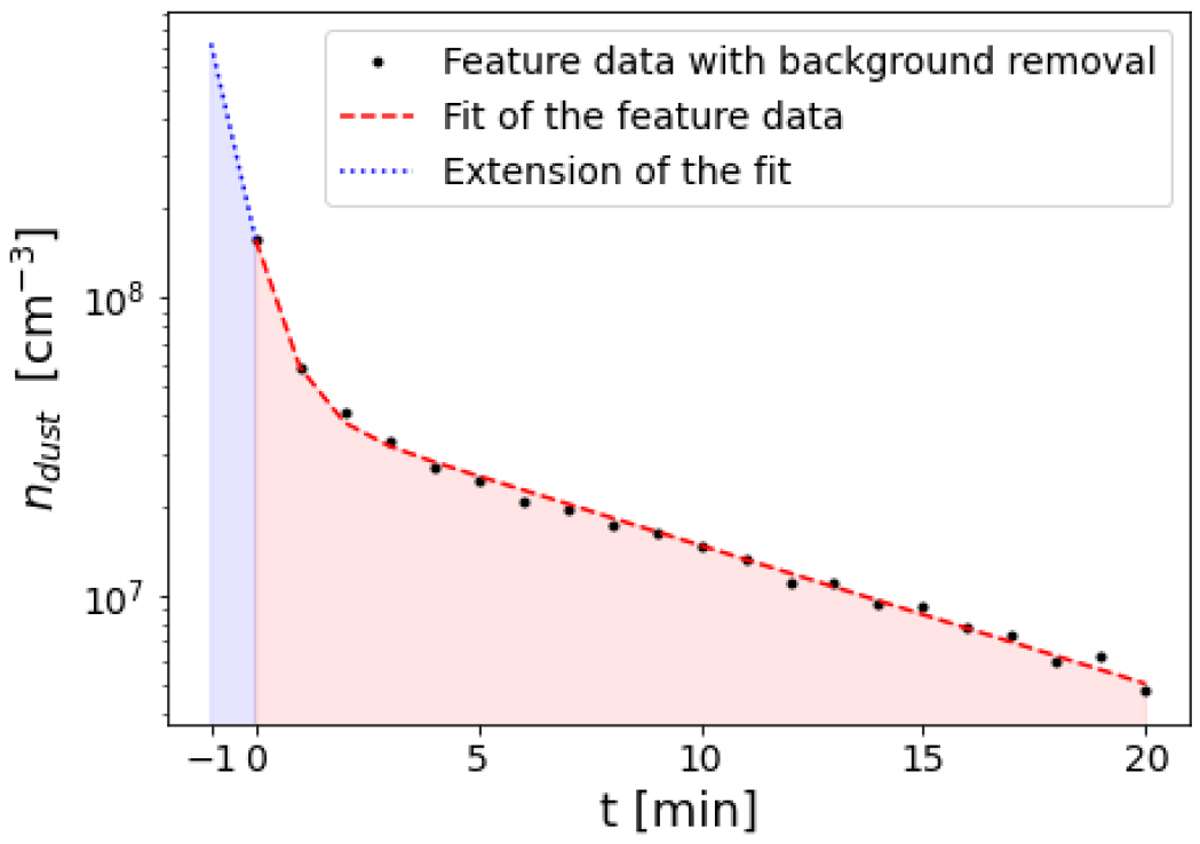
Extension of the fit of the feature data. This allows to visualise the source of error on the size of volatiles resulting from the uncertainty in the exact impact time. The chosen feature is the same as the one already proposed in Figs. 1 and 4. Since the feature was extracted from the monitoring mode, the fit (red dashed line) on the residuals representing the density due to sublimation (black dots) is extended for sixty seconds (blue dotted line).
Current usage metrics show cumulative count of Article Views (full-text article views including HTML views, PDF and ePub downloads, according to the available data) and Abstracts Views on Vision4Press platform.
Data correspond to usage on the plateform after 2015. The current usage metrics is available 48-96 hours after online publication and is updated daily on week days.
Initial download of the metrics may take a while.