Free Access
Fig. 5
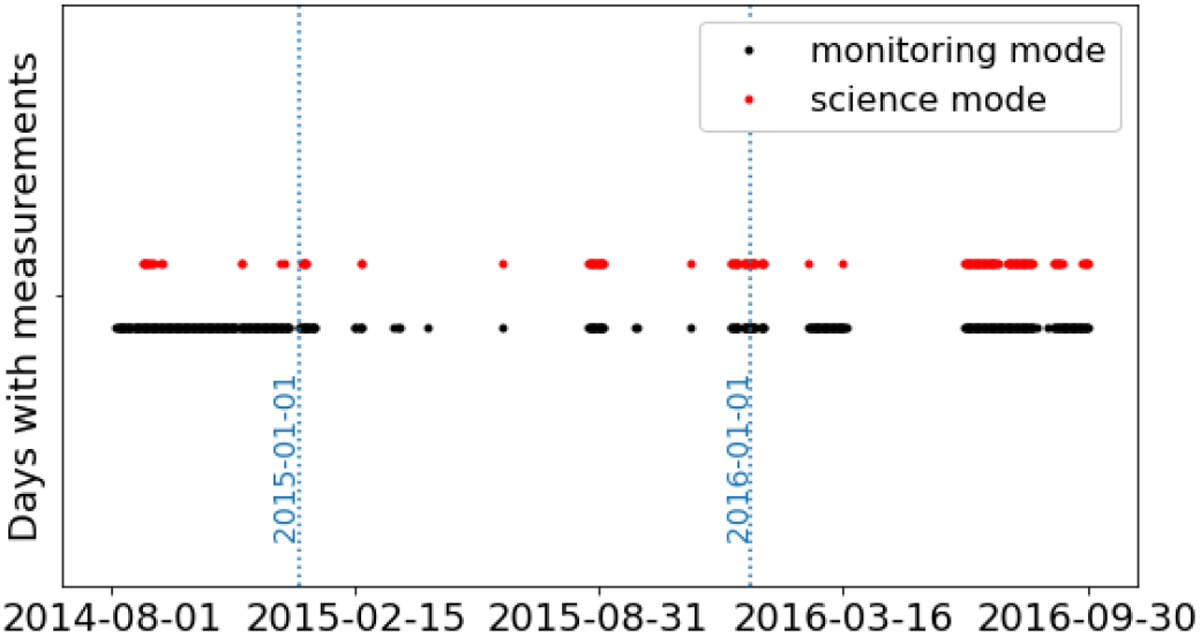
Days between 01 August 2014 and 30 September 2016 when the RG carried out measurements (black points for the monitoring mode, red points for the science mode). Large gaps without data, mainly during 2015, are present.
Current usage metrics show cumulative count of Article Views (full-text article views including HTML views, PDF and ePub downloads, according to the available data) and Abstracts Views on Vision4Press platform.
Data correspond to usage on the plateform after 2015. The current usage metrics is available 48-96 hours after online publication and is updated daily on week days.
Initial download of the metrics may take a while.