Fig. 4
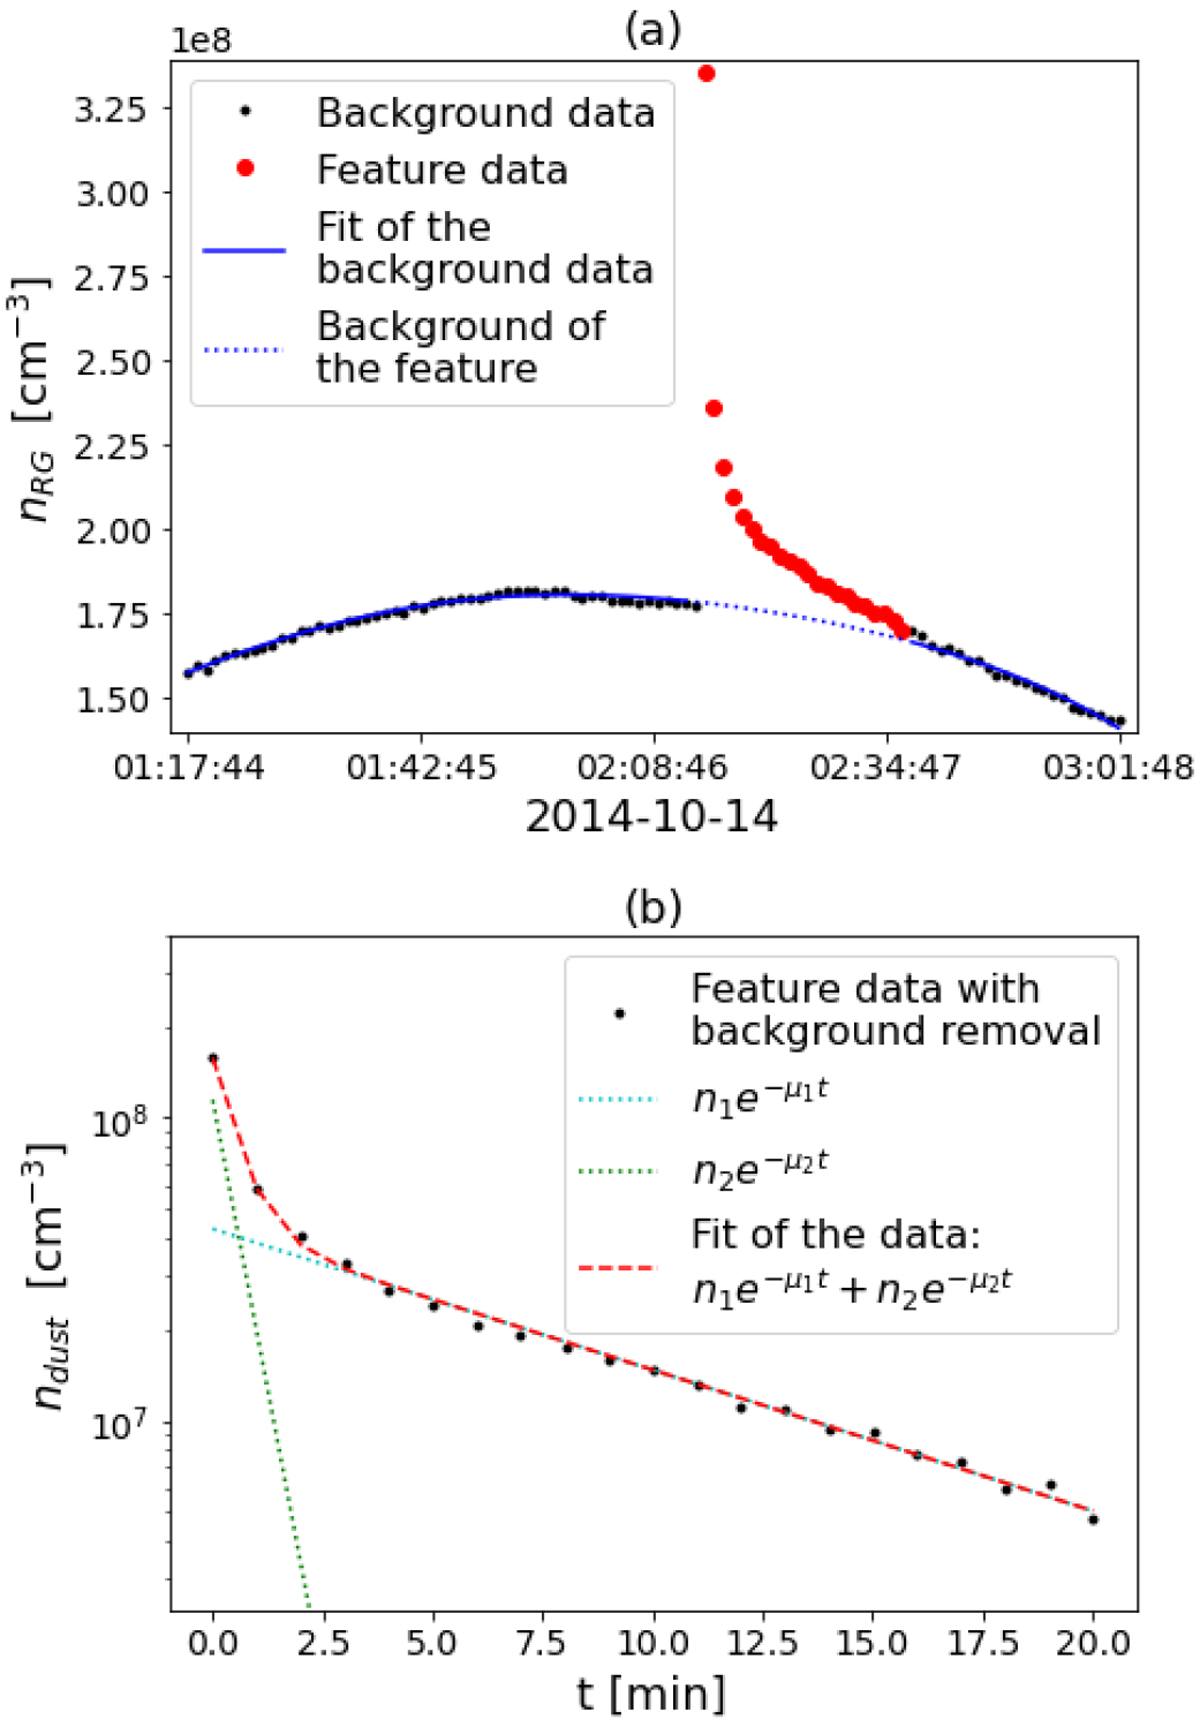
Fitting of the RG measurements. The feature chosen is the one on 4 October 2014 at 02:12:46, the same as in Fig. 1. Panel a: density measured by the RG as a function of time. The measurements representing the nominal RGsignal (black dots), the data points attributed to the feature (red dots), the fifth degree polynomial fit to the nominal RG signal data (solid blue line), and the extension of the fit to the region where the feature is located (dotted blueline) are displayed. Panel b: residuals representing the density due to the outgassing of the volatiles in the icy particle as a function of the time elapsed since the beginning of their sublimation (black dots). The fit to the residuals (red dashed line) is given by the sum of two exponential decay functions (green and light blue dotted lines).
Current usage metrics show cumulative count of Article Views (full-text article views including HTML views, PDF and ePub downloads, according to the available data) and Abstracts Views on Vision4Press platform.
Data correspond to usage on the plateform after 2015. The current usage metrics is available 48-96 hours after online publication and is updated daily on week days.
Initial download of the metrics may take a while.