Fig. 3
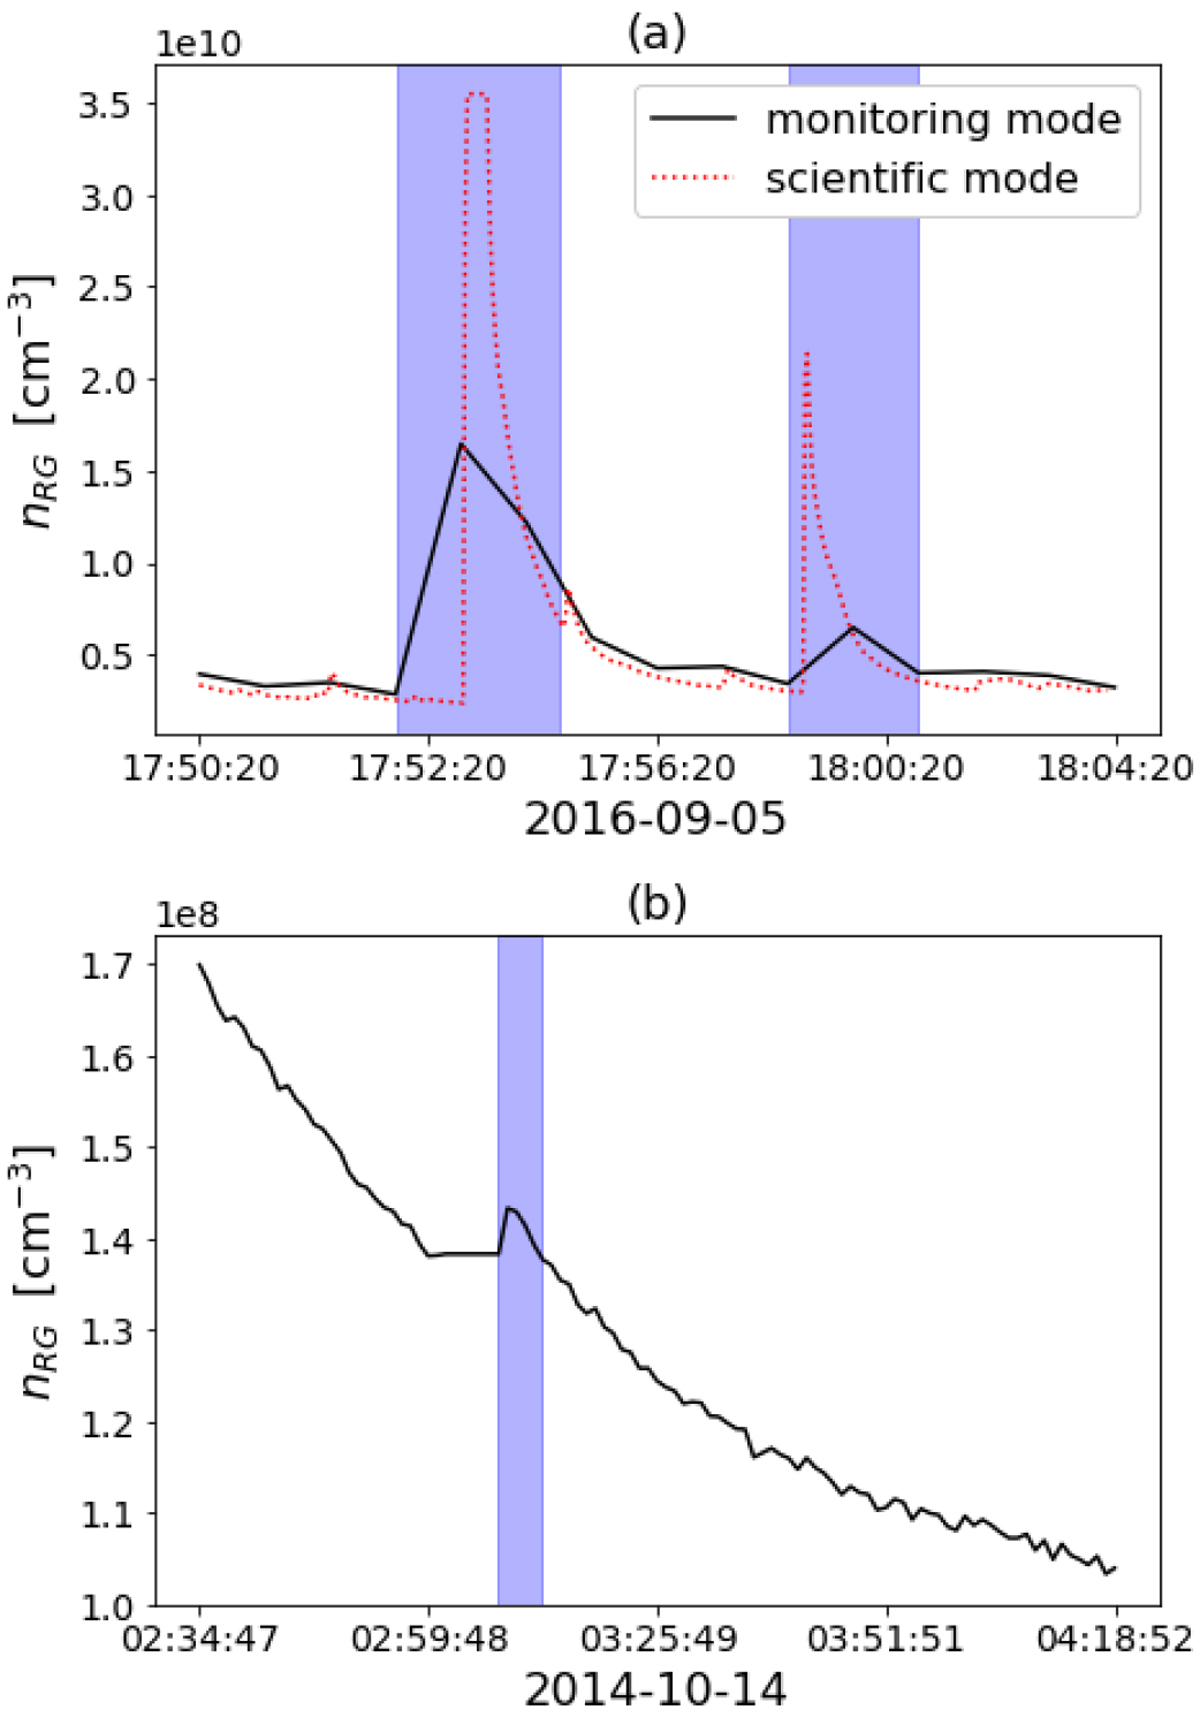
Examples of two of the difficulties that can be encountered during the extraction of features generated by the sublimation of volatiles in icy particles. Panel a: density measured by the RG (black solid line for the monitoring mode, red dotted line for the science mode) on 26 October 2014. Two density peaks are observable which, although attributable to the sublimation of volatiles in icy particles, are not resolved enough to display the tail in the monitoring mode. In this particular case, the science mode was active, so the tail of both features is visible when considering the more refined mode. It should be noted that the upper part of the first feature measured using the science mode is flat, meaning that the RG has reached saturation. This aspect is discussed in Sect. 2.4. Panel b: density measured by the RG on 14 October 2014. This plot shows an example of a feature that could erroneously be interpreted as the presence of an icy particle inside the RG. However, this feature can be confidently attributed to an offset measurement because just before the increase in density, there is a plateau lasting eight minutes, during which the measured values are exactly the same.
Current usage metrics show cumulative count of Article Views (full-text article views including HTML views, PDF and ePub downloads, according to the available data) and Abstracts Views on Vision4Press platform.
Data correspond to usage on the plateform after 2015. The current usage metrics is available 48-96 hours after online publication and is updated daily on week days.
Initial download of the metrics may take a while.