Free Access
Fig. 14.
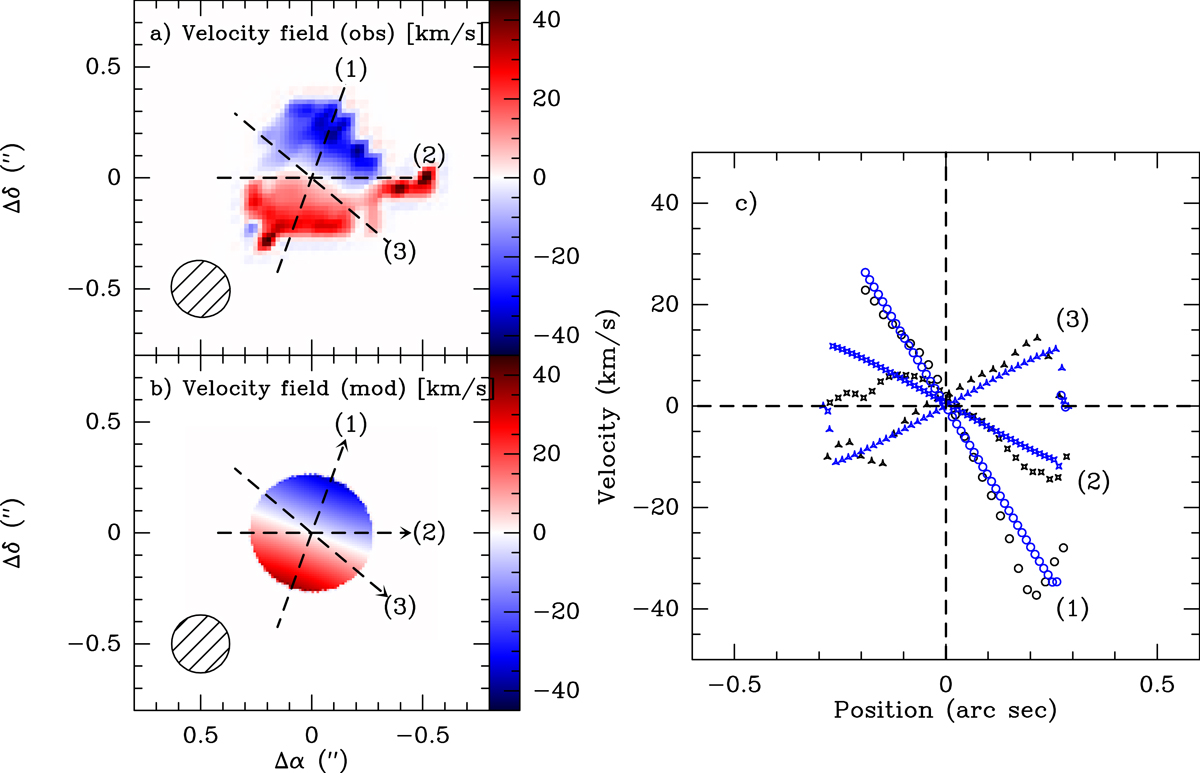
Velocity field associated with the H2O448 map (panel a) is compared with our 3D model A (panel b). The velocity along the three axes indicated in these panels is shown in panel c, where black and blue symbols correspond to data and model, respectively.
Current usage metrics show cumulative count of Article Views (full-text article views including HTML views, PDF and ePub downloads, according to the available data) and Abstracts Views on Vision4Press platform.
Data correspond to usage on the plateform after 2015. The current usage metrics is available 48-96 hours after online publication and is updated daily on week days.
Initial download of the metrics may take a while.