Fig. 8.
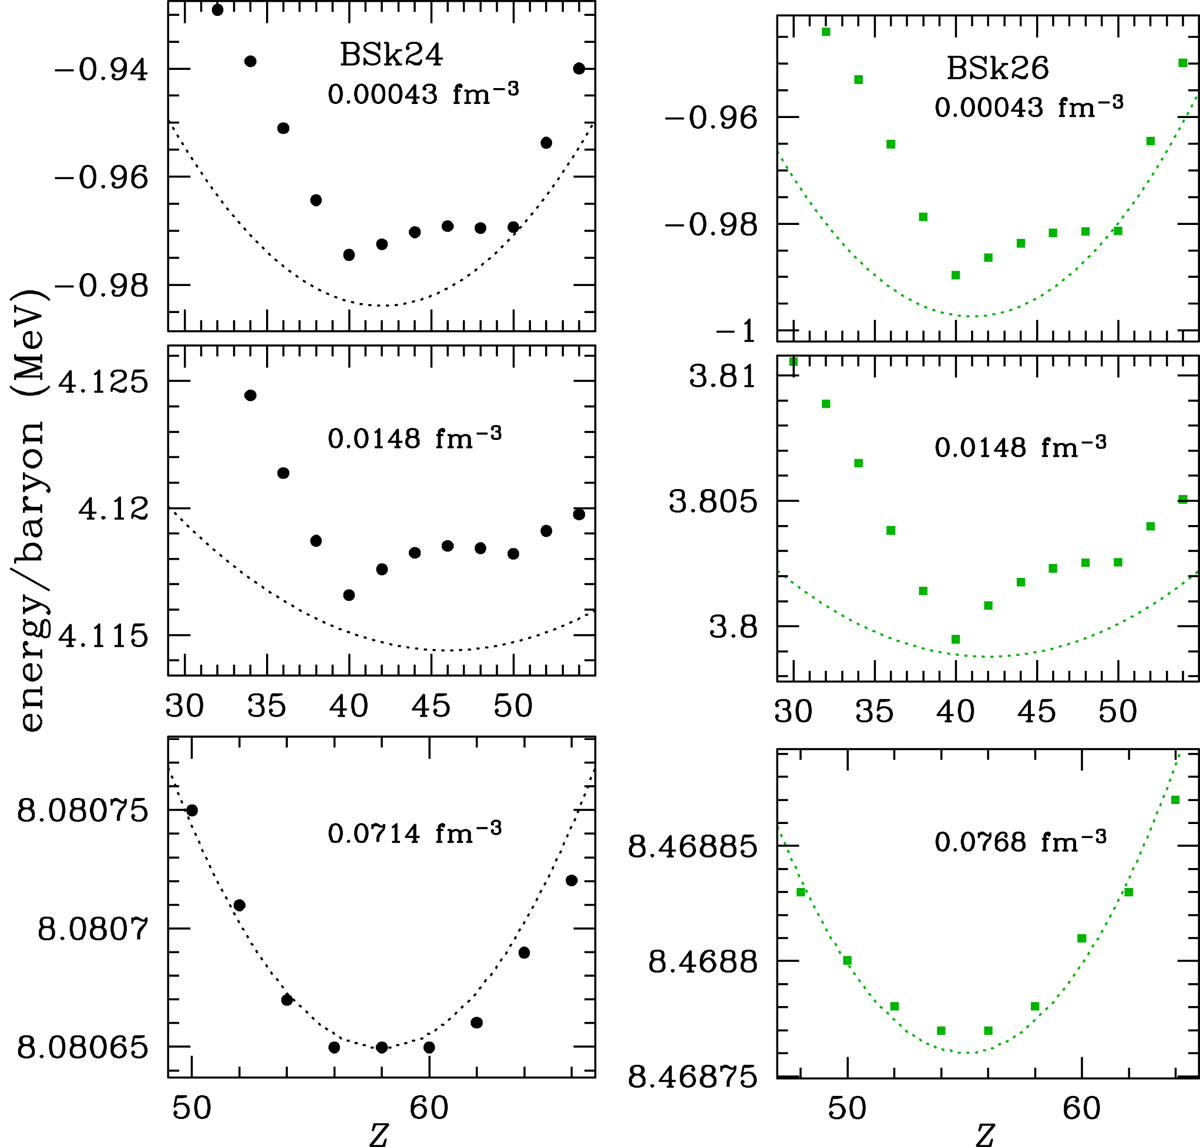
Energy per baryon as a function of the nuclear charge number for the functionals BSk24 (left) and BSk26 (right) at densities near the top, in the middle, and near the bottom of the inner crust (the top, middle, and bottom panels, respectively). The symbols show the computed energy values, and the dotted line shows the parabolic approximation near the energy minimum in the ETF approximation.
Current usage metrics show cumulative count of Article Views (full-text article views including HTML views, PDF and ePub downloads, according to the available data) and Abstracts Views on Vision4Press platform.
Data correspond to usage on the plateform after 2015. The current usage metrics is available 48-96 hours after online publication and is updated daily on week days.
Initial download of the metrics may take a while.