Fig. 3.
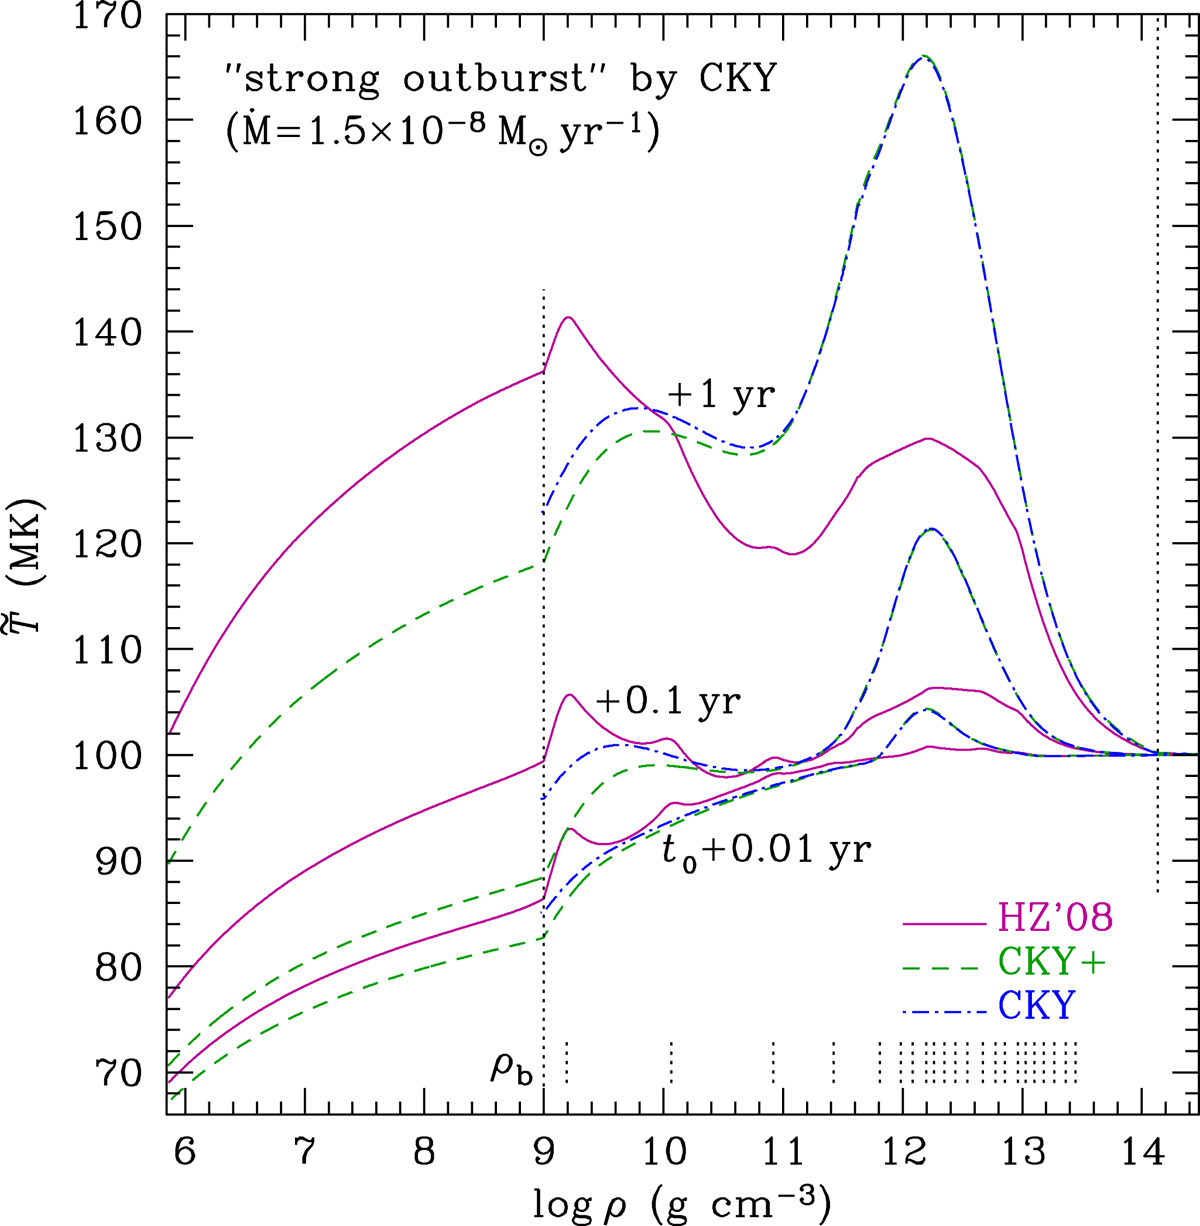
Redshifted temperature as function of mass density at selected time moments (marked near the curves) during the outburst for the same three models of the crust as in Fig. 2. The labels at the left mark the time since the start of the outburst. The redshifted temperature in the core is ![]() K. The long vertical dotted lines mark the boundaries of the crust with the envelope and the core. The short vertical dotted lines mark the positions of the heat sources in the HZ’08 model.
K. The long vertical dotted lines mark the boundaries of the crust with the envelope and the core. The short vertical dotted lines mark the positions of the heat sources in the HZ’08 model.
Current usage metrics show cumulative count of Article Views (full-text article views including HTML views, PDF and ePub downloads, according to the available data) and Abstracts Views on Vision4Press platform.
Data correspond to usage on the plateform after 2015. The current usage metrics is available 48-96 hours after online publication and is updated daily on week days.
Initial download of the metrics may take a while.