Open Access
Fig. 20.
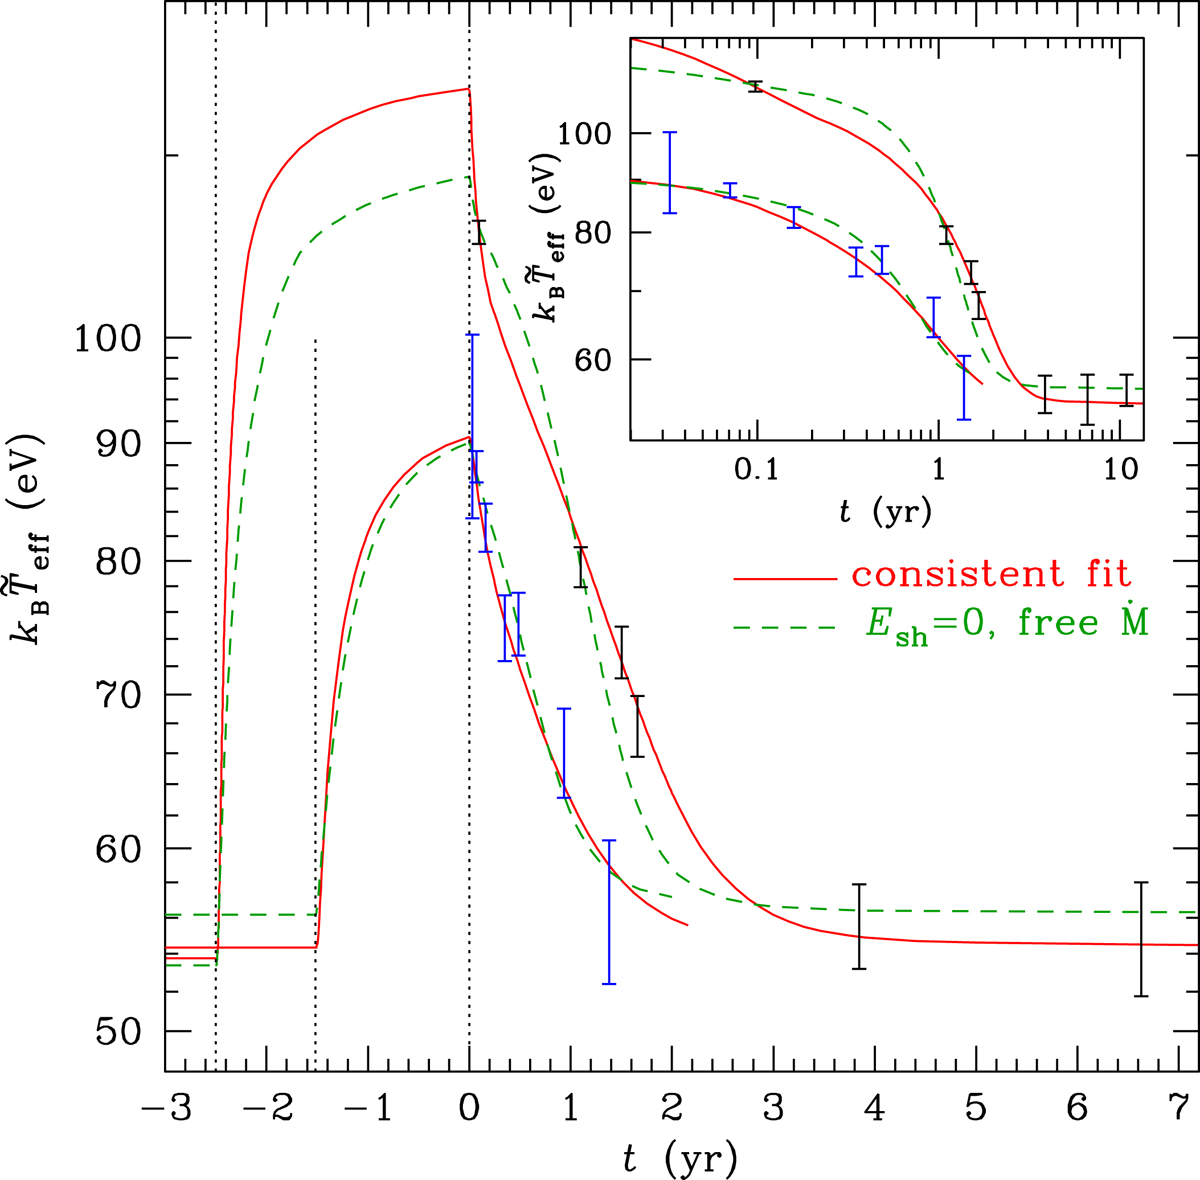
Theoretical light curves and observations for the outbursts I and II (upper and lower lines and errorbars, respectively). The dashed curve is obtained without shallow heating, but with accretion rates adjusted ad hoc (see text). The solid line reproduces the consistent fit (line 5 from Fig. 17).
Current usage metrics show cumulative count of Article Views (full-text article views including HTML views, PDF and ePub downloads, according to the available data) and Abstracts Views on Vision4Press platform.
Data correspond to usage on the plateform after 2015. The current usage metrics is available 48-96 hours after online publication and is updated daily on week days.
Initial download of the metrics may take a while.