Fig. 2.
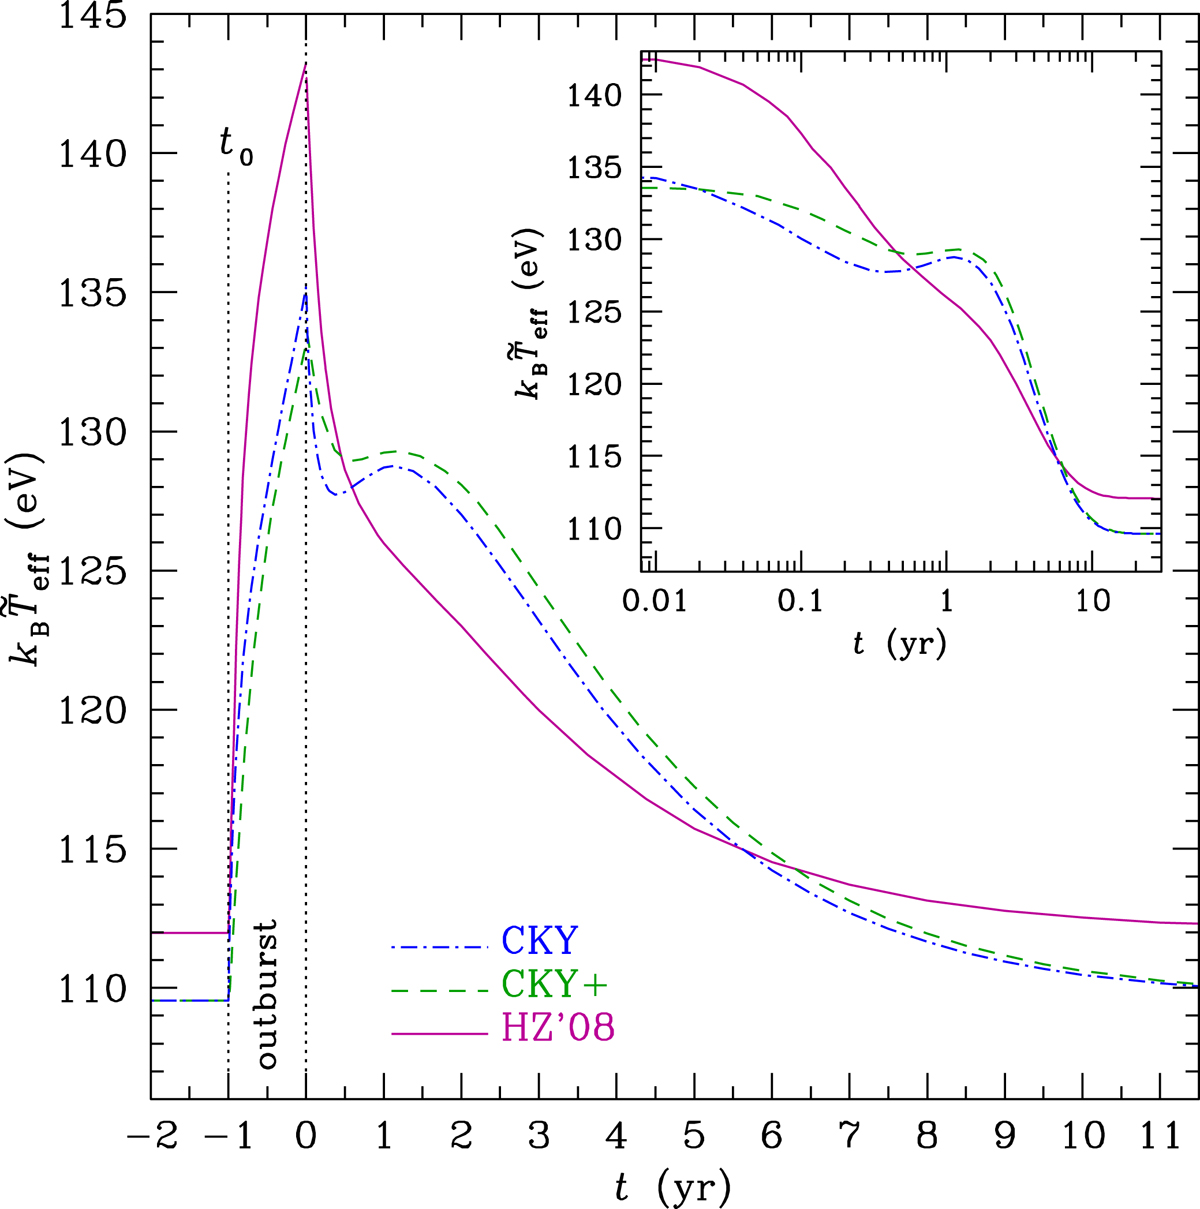
Light curves for a “strong outburst” model of CKY (see text), computed for different crust models. The heat flux toward the surface of a neutron star is expressed in terms of redshifted effective temperature ![]() and plotted as function of time measured from the end of the outburst. The dot-dashed line corresponds to the original CKY model, i.e., the helium quasi-stationary envelope at ρ < 109 g cm−3 and the ground-state composition at higher densities with the heat sources distributed according to the CKY approximation. The dashed line (CKY+) shows the same model, but with an accurate treatment of thermal evolution of the envelope (beyond the approximation of a quasi-stationary envelope). The solid line represents a more accurate treatment of the crust with composition and heat source distribution according to the HZ’08 model. The inset shows the same three curves in logarithmic scale for time after the end of the outburst, t > 0.
and plotted as function of time measured from the end of the outburst. The dot-dashed line corresponds to the original CKY model, i.e., the helium quasi-stationary envelope at ρ < 109 g cm−3 and the ground-state composition at higher densities with the heat sources distributed according to the CKY approximation. The dashed line (CKY+) shows the same model, but with an accurate treatment of thermal evolution of the envelope (beyond the approximation of a quasi-stationary envelope). The solid line represents a more accurate treatment of the crust with composition and heat source distribution according to the HZ’08 model. The inset shows the same three curves in logarithmic scale for time after the end of the outburst, t > 0.
Current usage metrics show cumulative count of Article Views (full-text article views including HTML views, PDF and ePub downloads, according to the available data) and Abstracts Views on Vision4Press platform.
Data correspond to usage on the plateform after 2015. The current usage metrics is available 48-96 hours after online publication and is updated daily on week days.
Initial download of the metrics may take a while.