Fig. 18.
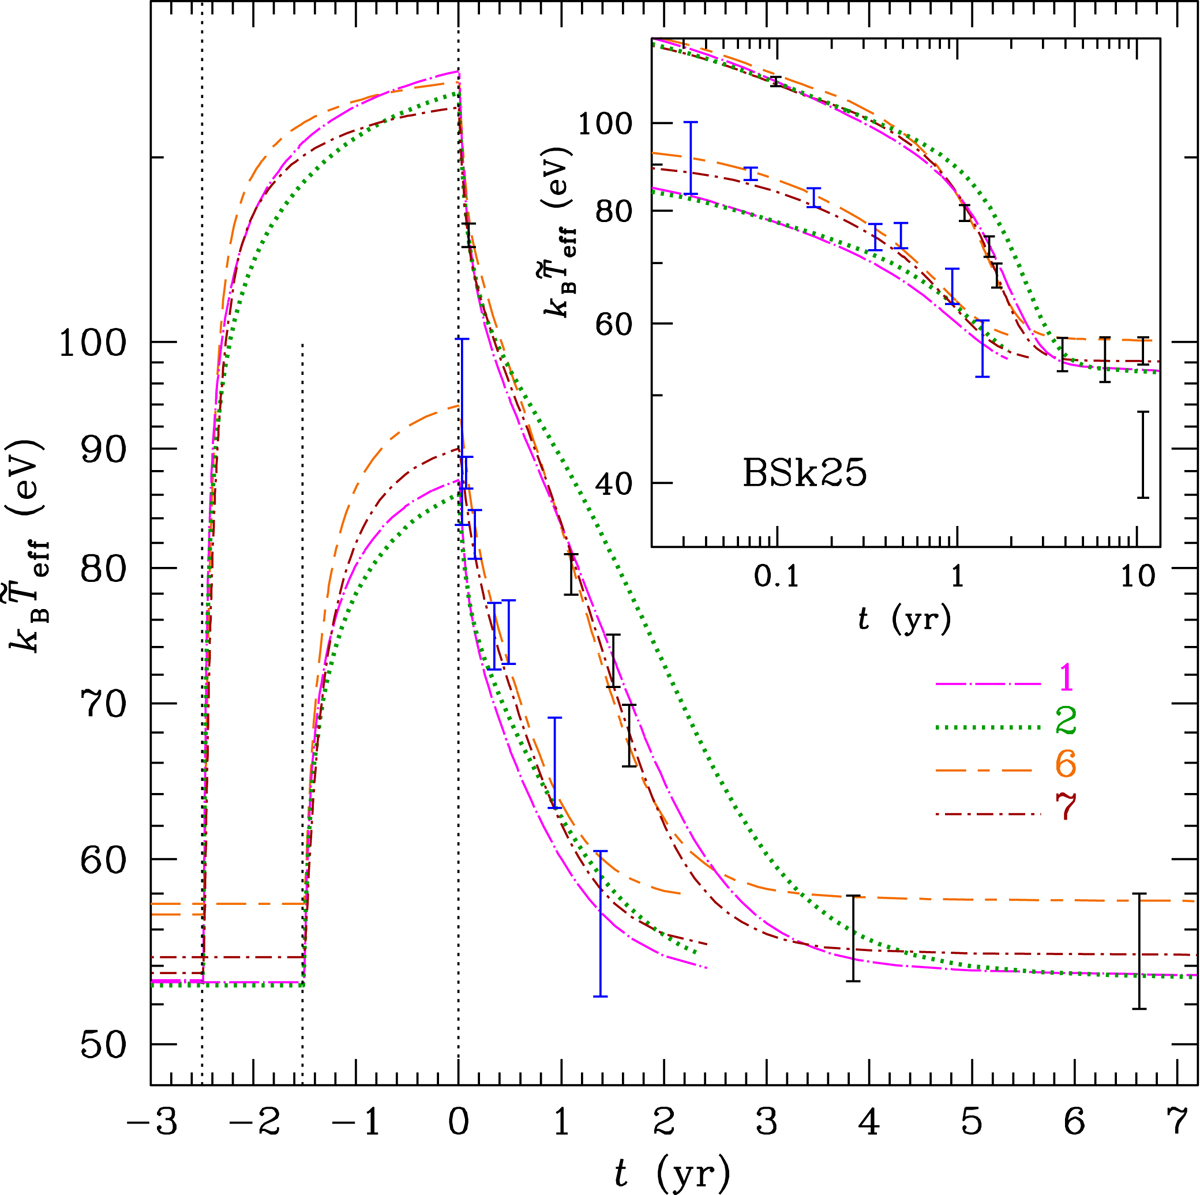
Simulated light curves for the outbursts I and II (upper and lower lines and errorbars, respectively) versus observations, as in Fig. 17 but using the BSk25 EoS model. Curves 1 and 2 are computed assuming carbon envelope and the same accreted crust composition and heating parameters as in Fig. 17; curves 6 and 7 are computed assuming helium envelope with the parameters adjusted to observations as in Fig. 17 (see Table 1 and the text for details).
Current usage metrics show cumulative count of Article Views (full-text article views including HTML views, PDF and ePub downloads, according to the available data) and Abstracts Views on Vision4Press platform.
Data correspond to usage on the plateform after 2015. The current usage metrics is available 48-96 hours after online publication and is updated daily on week days.
Initial download of the metrics may take a while.