Fig. 13.
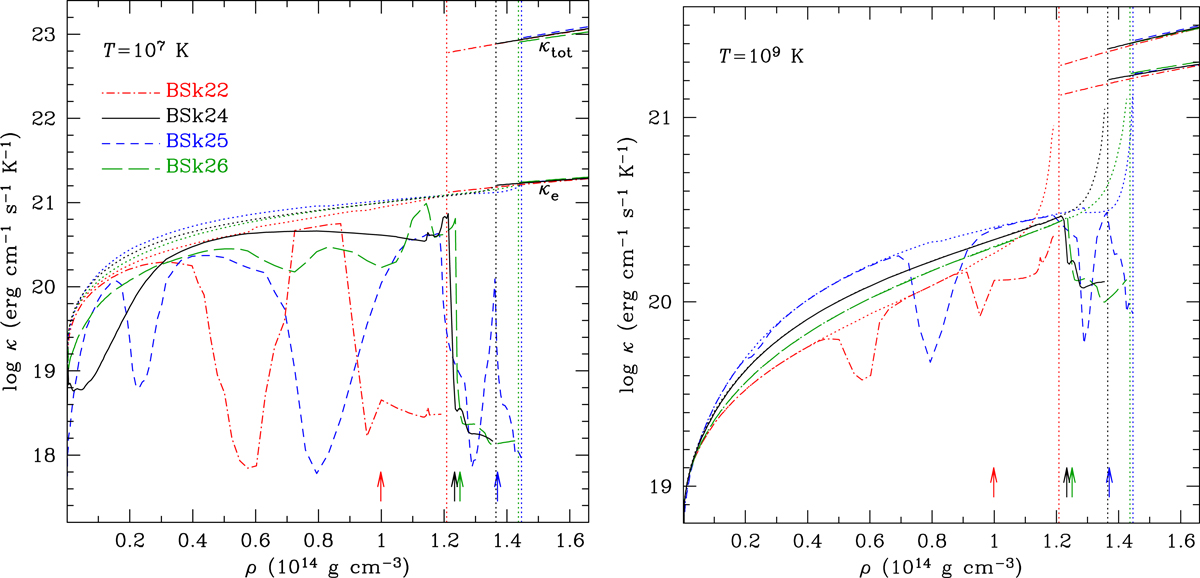
Thermal conductivity as a function of the mass density for the models, BSk22, BSk24, BSk25, and BSk26 (dot-dashed, solid, short-dashed and long-dashed lines, respectively), in the inner crust and in the outer core. The conductivities are computed with the impurity parameter shown in Fig. 11 at temperatures T = 107 K (the left panel) and 109 K (the right panel). For comparison, thermal conductivities in the pure crust are drawn by the dotted curves. As in Fig. 7, the arrows mark the proton drip densities for the four EoSs, the vertical dotted lines mark the crust-core interfaces, and to the right of these lines (at the core densities) both the electron and total conductivities are shown.
Current usage metrics show cumulative count of Article Views (full-text article views including HTML views, PDF and ePub downloads, according to the available data) and Abstracts Views on Vision4Press platform.
Data correspond to usage on the plateform after 2015. The current usage metrics is available 48-96 hours after online publication and is updated daily on week days.
Initial download of the metrics may take a while.