Fig. 6
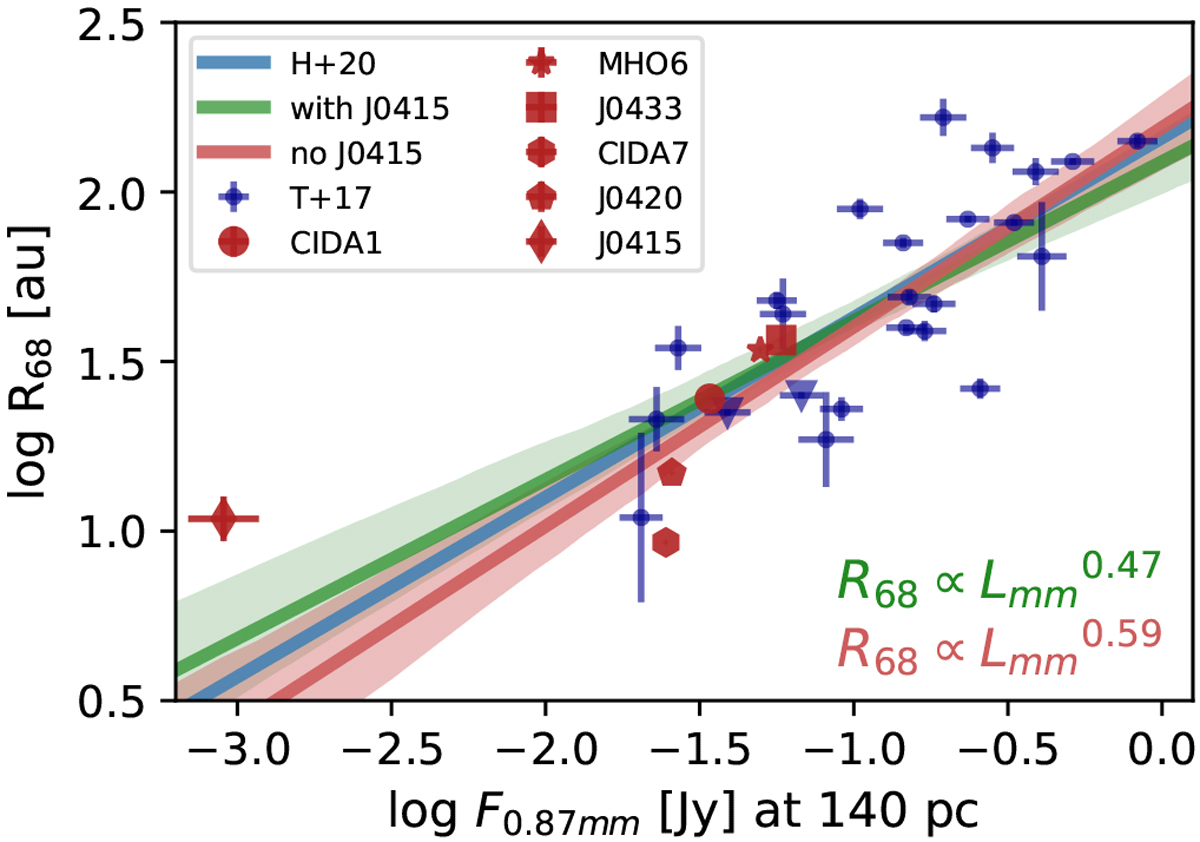
Relation between log(R68) and log (F0.87mm). The points in blue are from Tripathi et al. (2017), with distances scaled to 140 pc using distances inferred from Gaia DR2, similar to Andrews et al. (2018b). The solid line in blue is the linear regression found by Hendler et al. (2020) (abbreviated as H+20), fitting the data from Tripathi et al. (2017). The VLMS from this work are shown in red. The bests linear regression fits and their 68% confidence intervals are plotted in red when J0415 is excluded from the fit, and in green when all points are considered.
Current usage metrics show cumulative count of Article Views (full-text article views including HTML views, PDF and ePub downloads, according to the available data) and Abstracts Views on Vision4Press platform.
Data correspond to usage on the plateform after 2015. The current usage metrics is available 48-96 hours after online publication and is updated daily on week days.
Initial download of the metrics may take a while.