Fig. 2
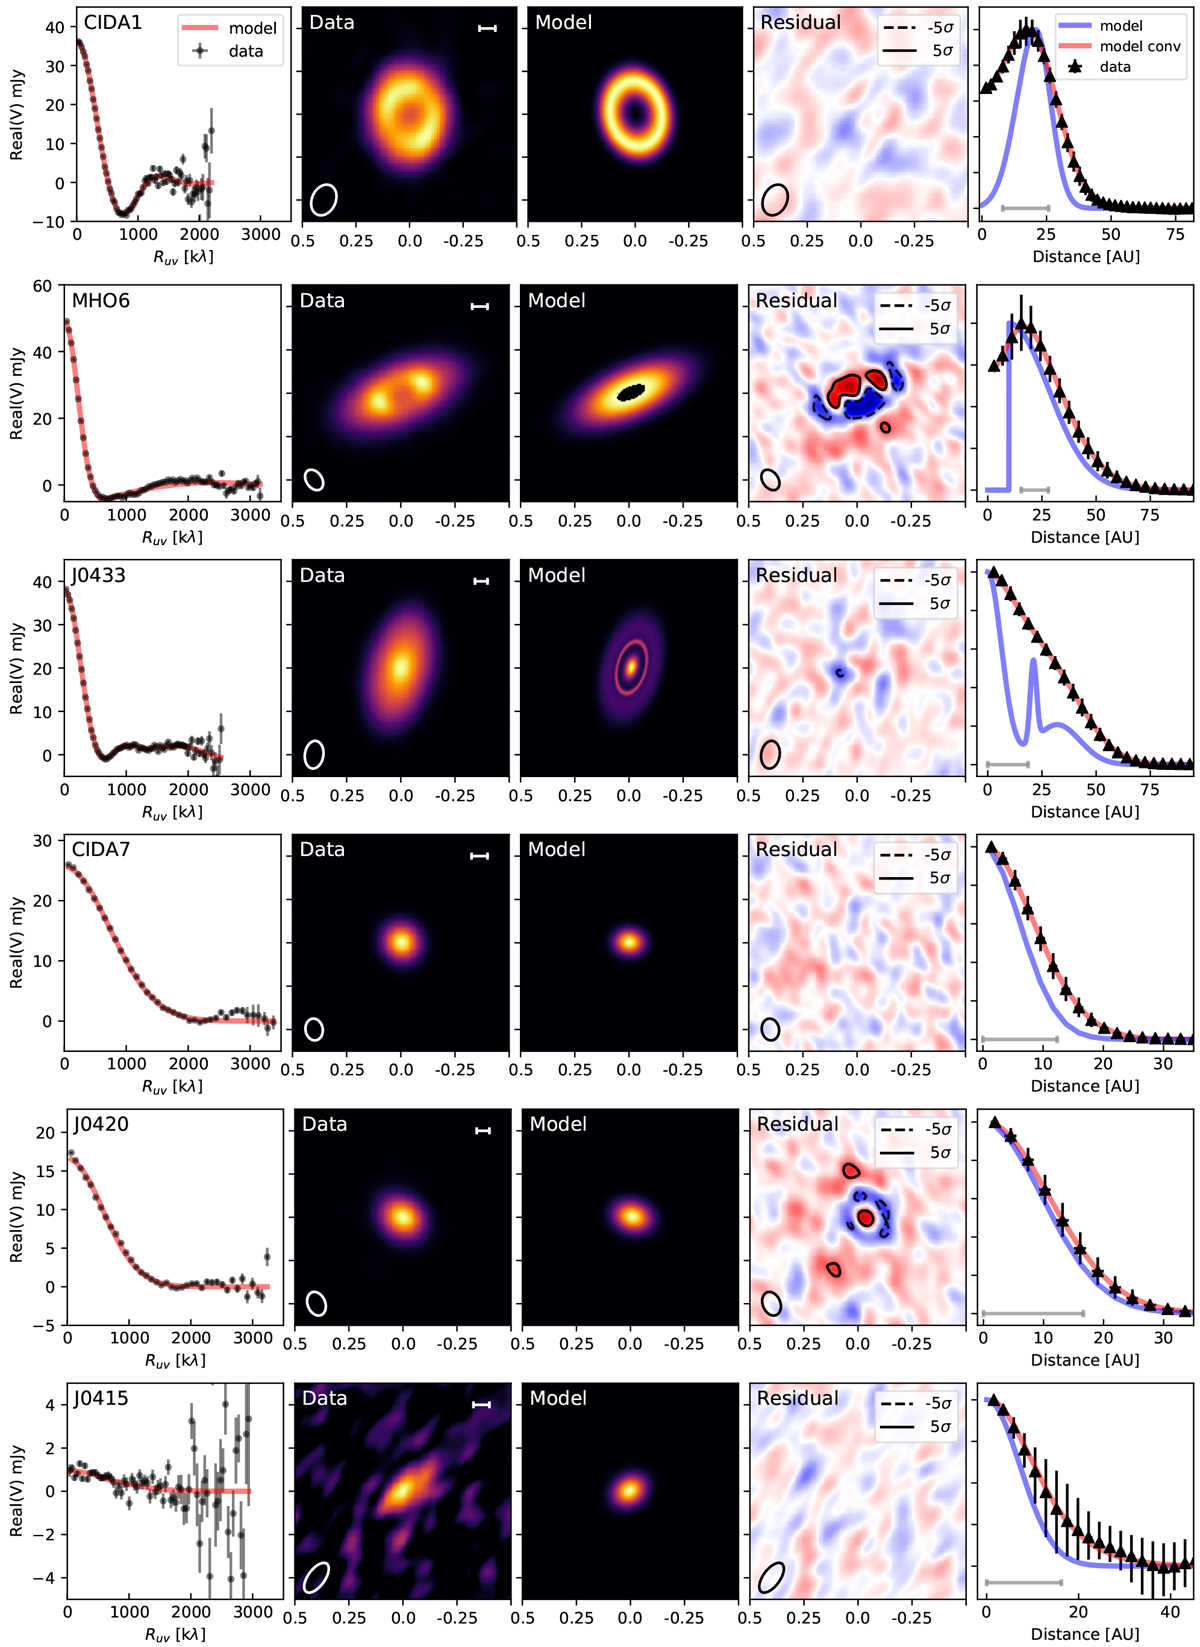
Visibility modeling versus observations of our sample. From left to right: (1) real part of the visibilities after centering and deprojecting the data versus the best fit model of the continuum data, (2) continuum emission of our sources where the scale bar represents a 10 au distance, (3) model image, (4) residual map (observations minus model), (5) and normalized, azimuthally-averaged radial profile calculated from the beam convolved images in comparison with the model without convolution (purple solid line) and after convolution (red solid line). In the right most plots, the gray scale shows the beam major axis.
Current usage metrics show cumulative count of Article Views (full-text article views including HTML views, PDF and ePub downloads, according to the available data) and Abstracts Views on Vision4Press platform.
Data correspond to usage on the plateform after 2015. The current usage metrics is available 48-96 hours after online publication and is updated daily on week days.
Initial download of the metrics may take a while.