Fig. B.5
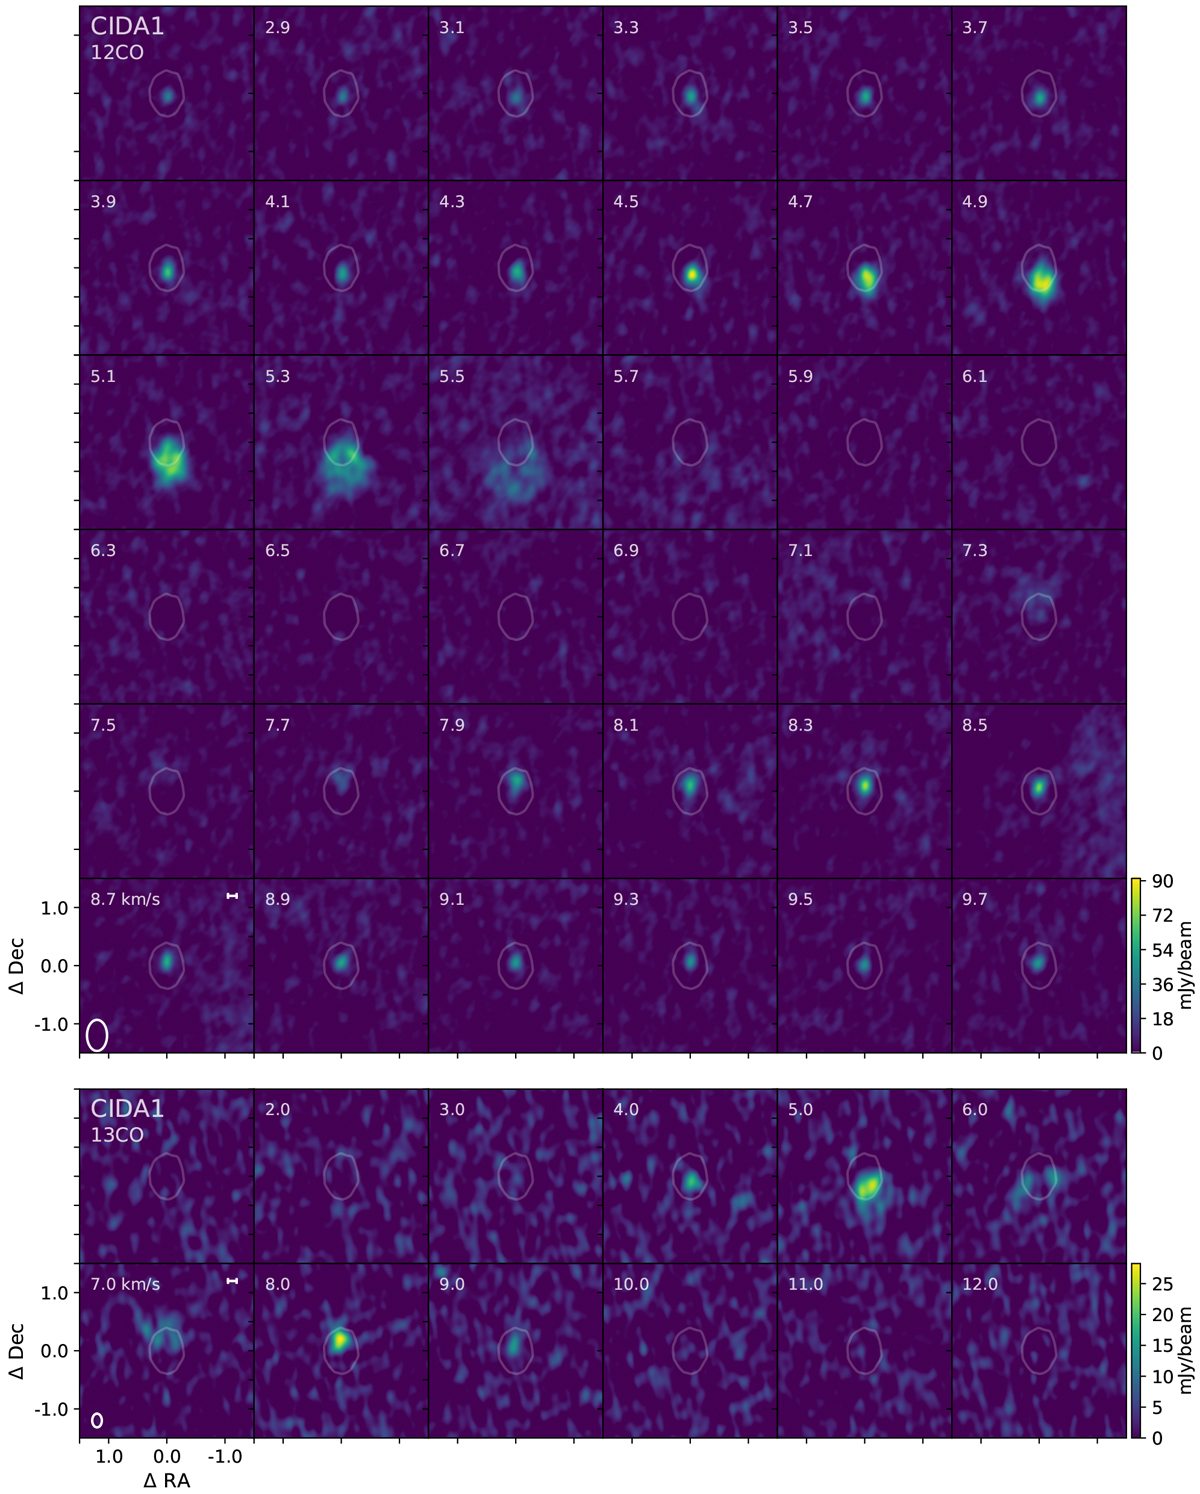
Images of CIDA 1 12CO channel maps are shown in the top, and 13CO channel maps are shown in the bottom. Each square is 3.0″ in width andheight, centered at the samed 13CO channel maps are shown in the bottom position as the dust continuum image. The contour level traces the 5σ emissionin the continuum image. The scale bar in the lower left panel is 20 au in size, and the beam size is found in the lower left corner of the same panel. Central velocities in km s−1 of each channel are given in the upper left corner of each panel.
Current usage metrics show cumulative count of Article Views (full-text article views including HTML views, PDF and ePub downloads, according to the available data) and Abstracts Views on Vision4Press platform.
Data correspond to usage on the plateform after 2015. The current usage metrics is available 48-96 hours after online publication and is updated daily on week days.
Initial download of the metrics may take a while.