Open Access
Fig. B.3
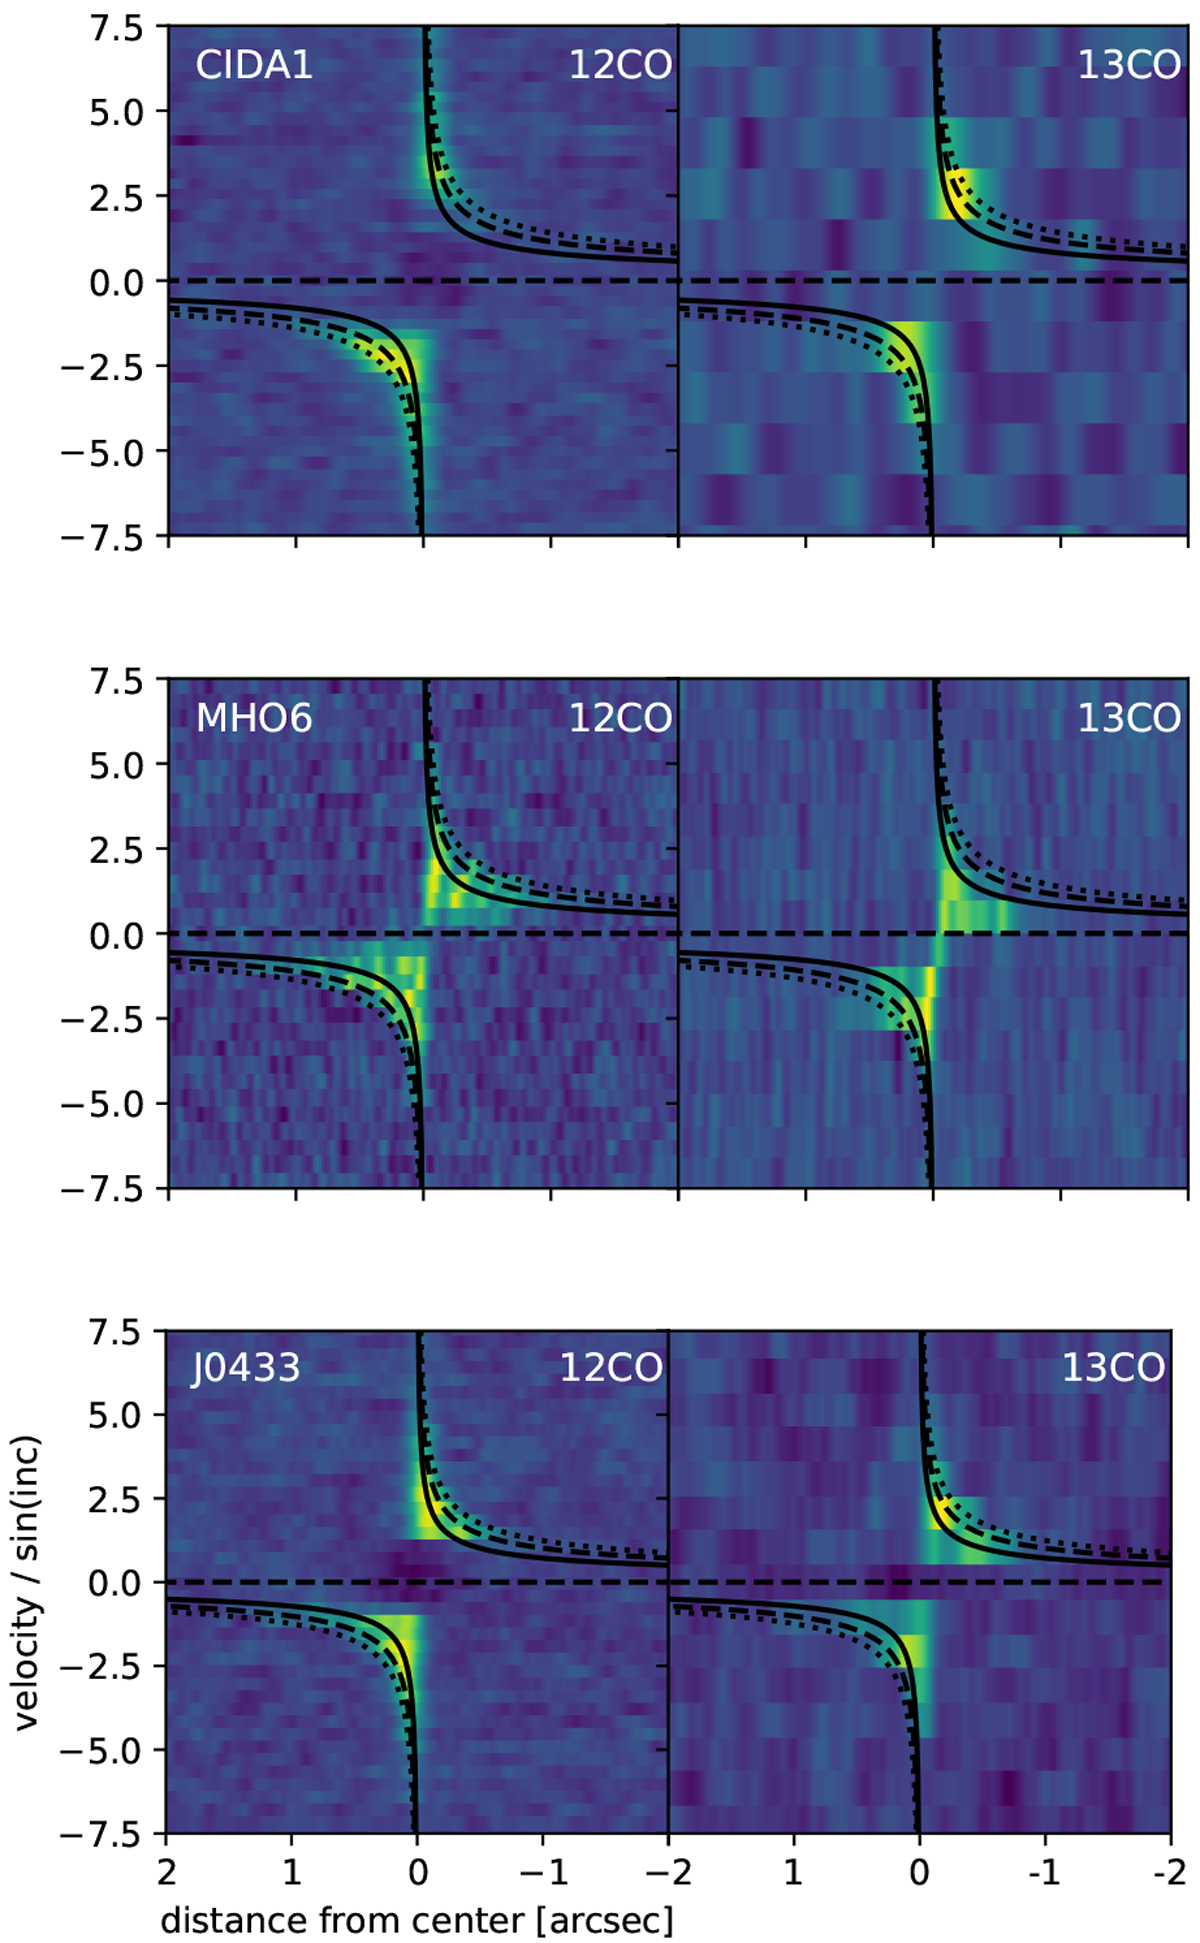
Position velocity diagrams for the sources where substructures are detected in the continuum emission. Lines follow the Keplerian velocities for central mass objects of 0.1, 0.2, and 0.3 M⊙ (solid, dashed, and dotted, respectively).
Current usage metrics show cumulative count of Article Views (full-text article views including HTML views, PDF and ePub downloads, according to the available data) and Abstracts Views on Vision4Press platform.
Data correspond to usage on the plateform after 2015. The current usage metrics is available 48-96 hours after online publication and is updated daily on week days.
Initial download of the metrics may take a while.