Fig. 1
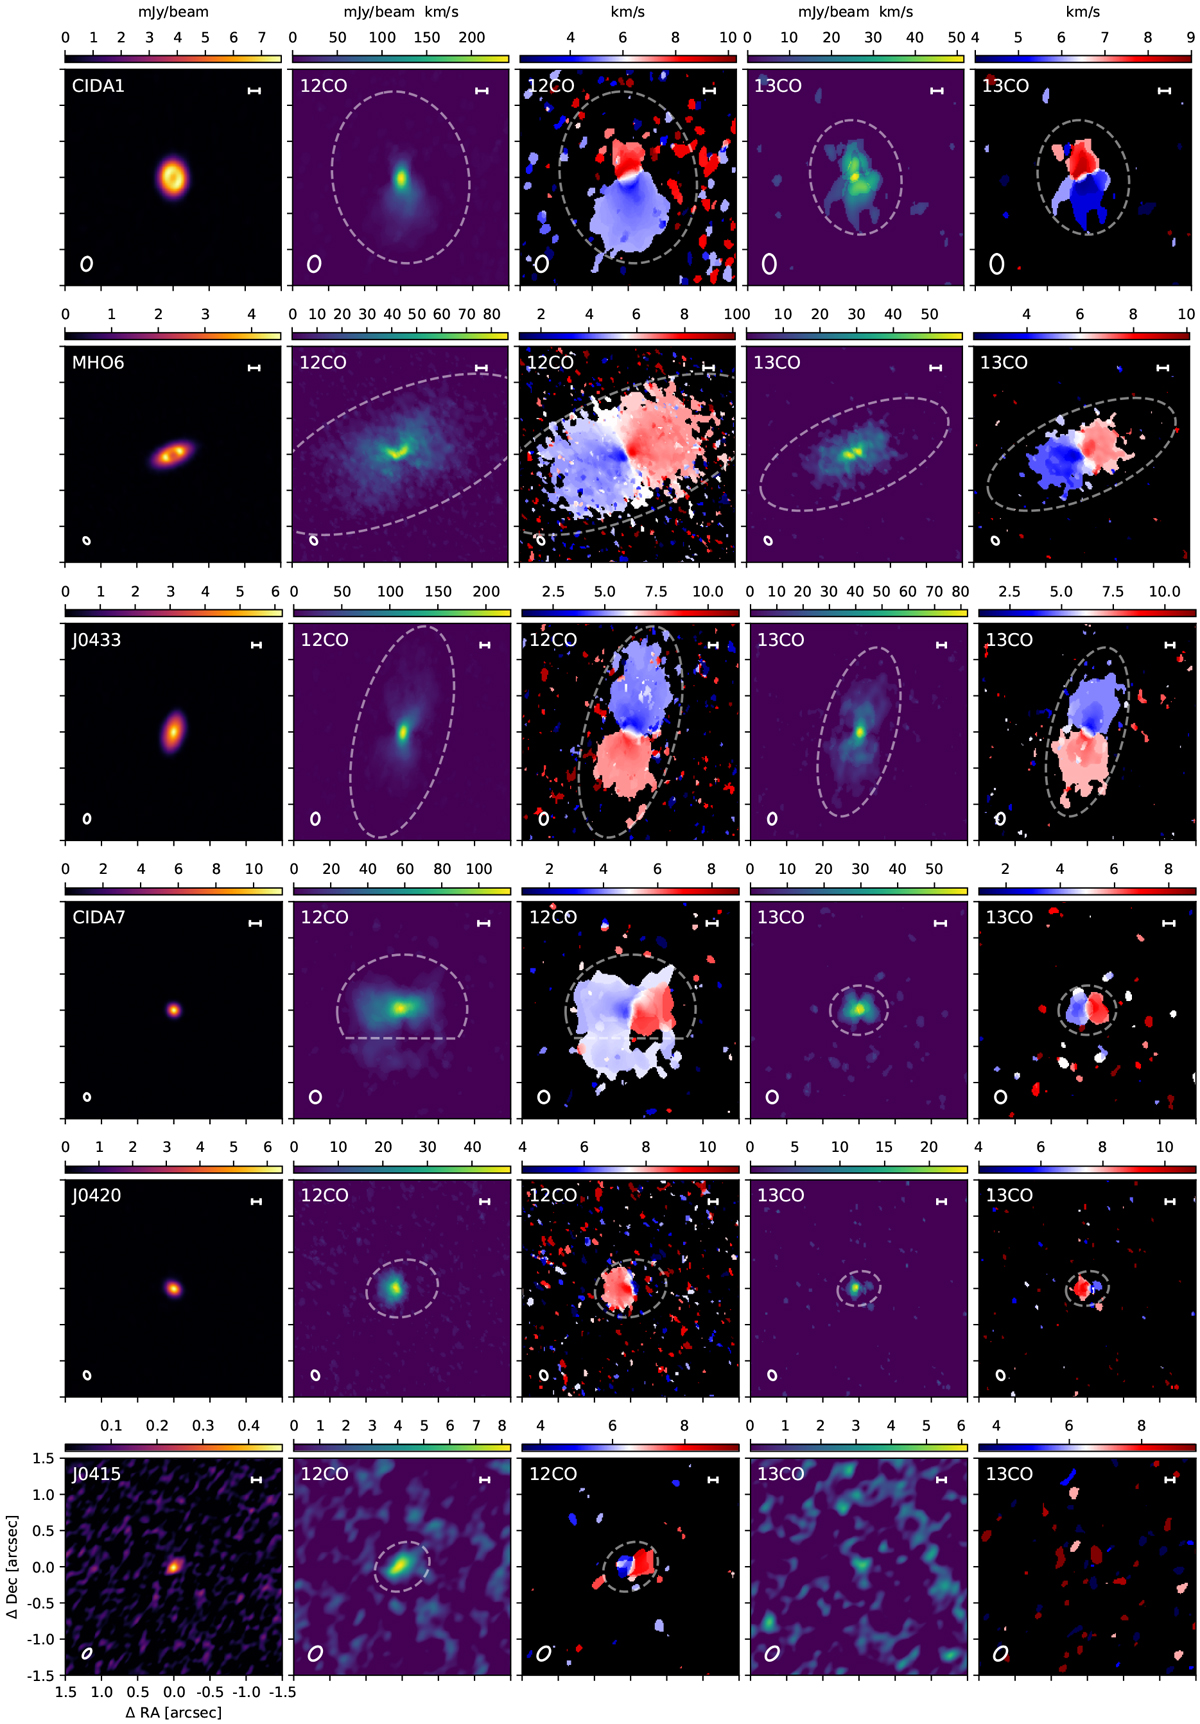
ALMA observations of the disks around VLMS in Taurus. From left to right: dust continuum emission, 12 CO moments 0 and 1, and 13CO moments 0 and 1. All boxes are 3.0″ in size. The scale bar represents 20 au, and the white ellipses show the synthesized beam. The centers, beam sizes, measured fluxes, and sensitivity are detailed in Tables A.2 and A.3. Dashed lines show the region used to calculate the radial profiles and to measure R68 and R90. A zoomed-in version of the continuum images can be found in Fig. 2.
Current usage metrics show cumulative count of Article Views (full-text article views including HTML views, PDF and ePub downloads, according to the available data) and Abstracts Views on Vision4Press platform.
Data correspond to usage on the plateform after 2015. The current usage metrics is available 48-96 hours after online publication and is updated daily on week days.
Initial download of the metrics may take a while.