Fig. 9.
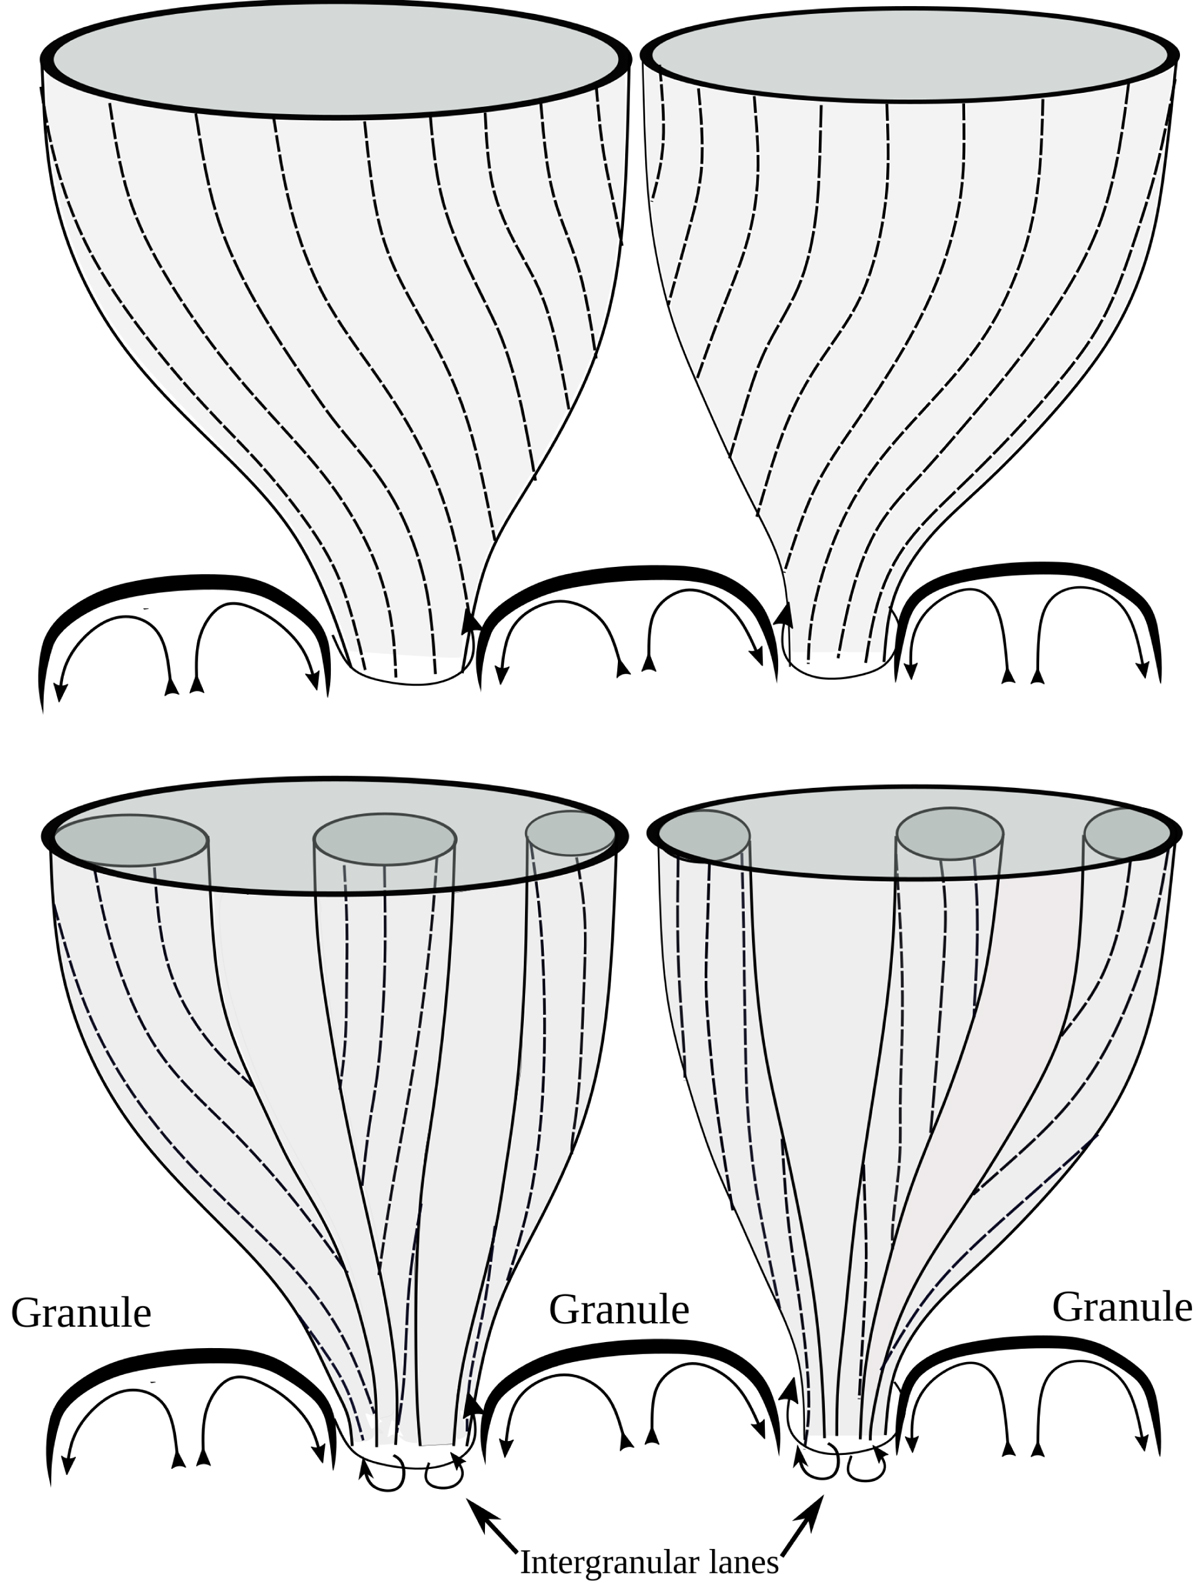
Simplified cartoon showing how turbulent motions drive vortices on different spatial scales. The lines with arrow heads represent the surface flows, being convective motions in the granules and small-scale turbulent motions in the intergranular lanes. These turbulent motions cover a range of scales and couple to the magnetic field (dashed curves) producing vortices at various scales from the whole flux tube (upper panel) down to the resolution limit of the simulation (lower panel).
Current usage metrics show cumulative count of Article Views (full-text article views including HTML views, PDF and ePub downloads, according to the available data) and Abstracts Views on Vision4Press platform.
Data correspond to usage on the plateform after 2015. The current usage metrics is available 48-96 hours after online publication and is updated daily on week days.
Initial download of the metrics may take a while.