Fig. 7.
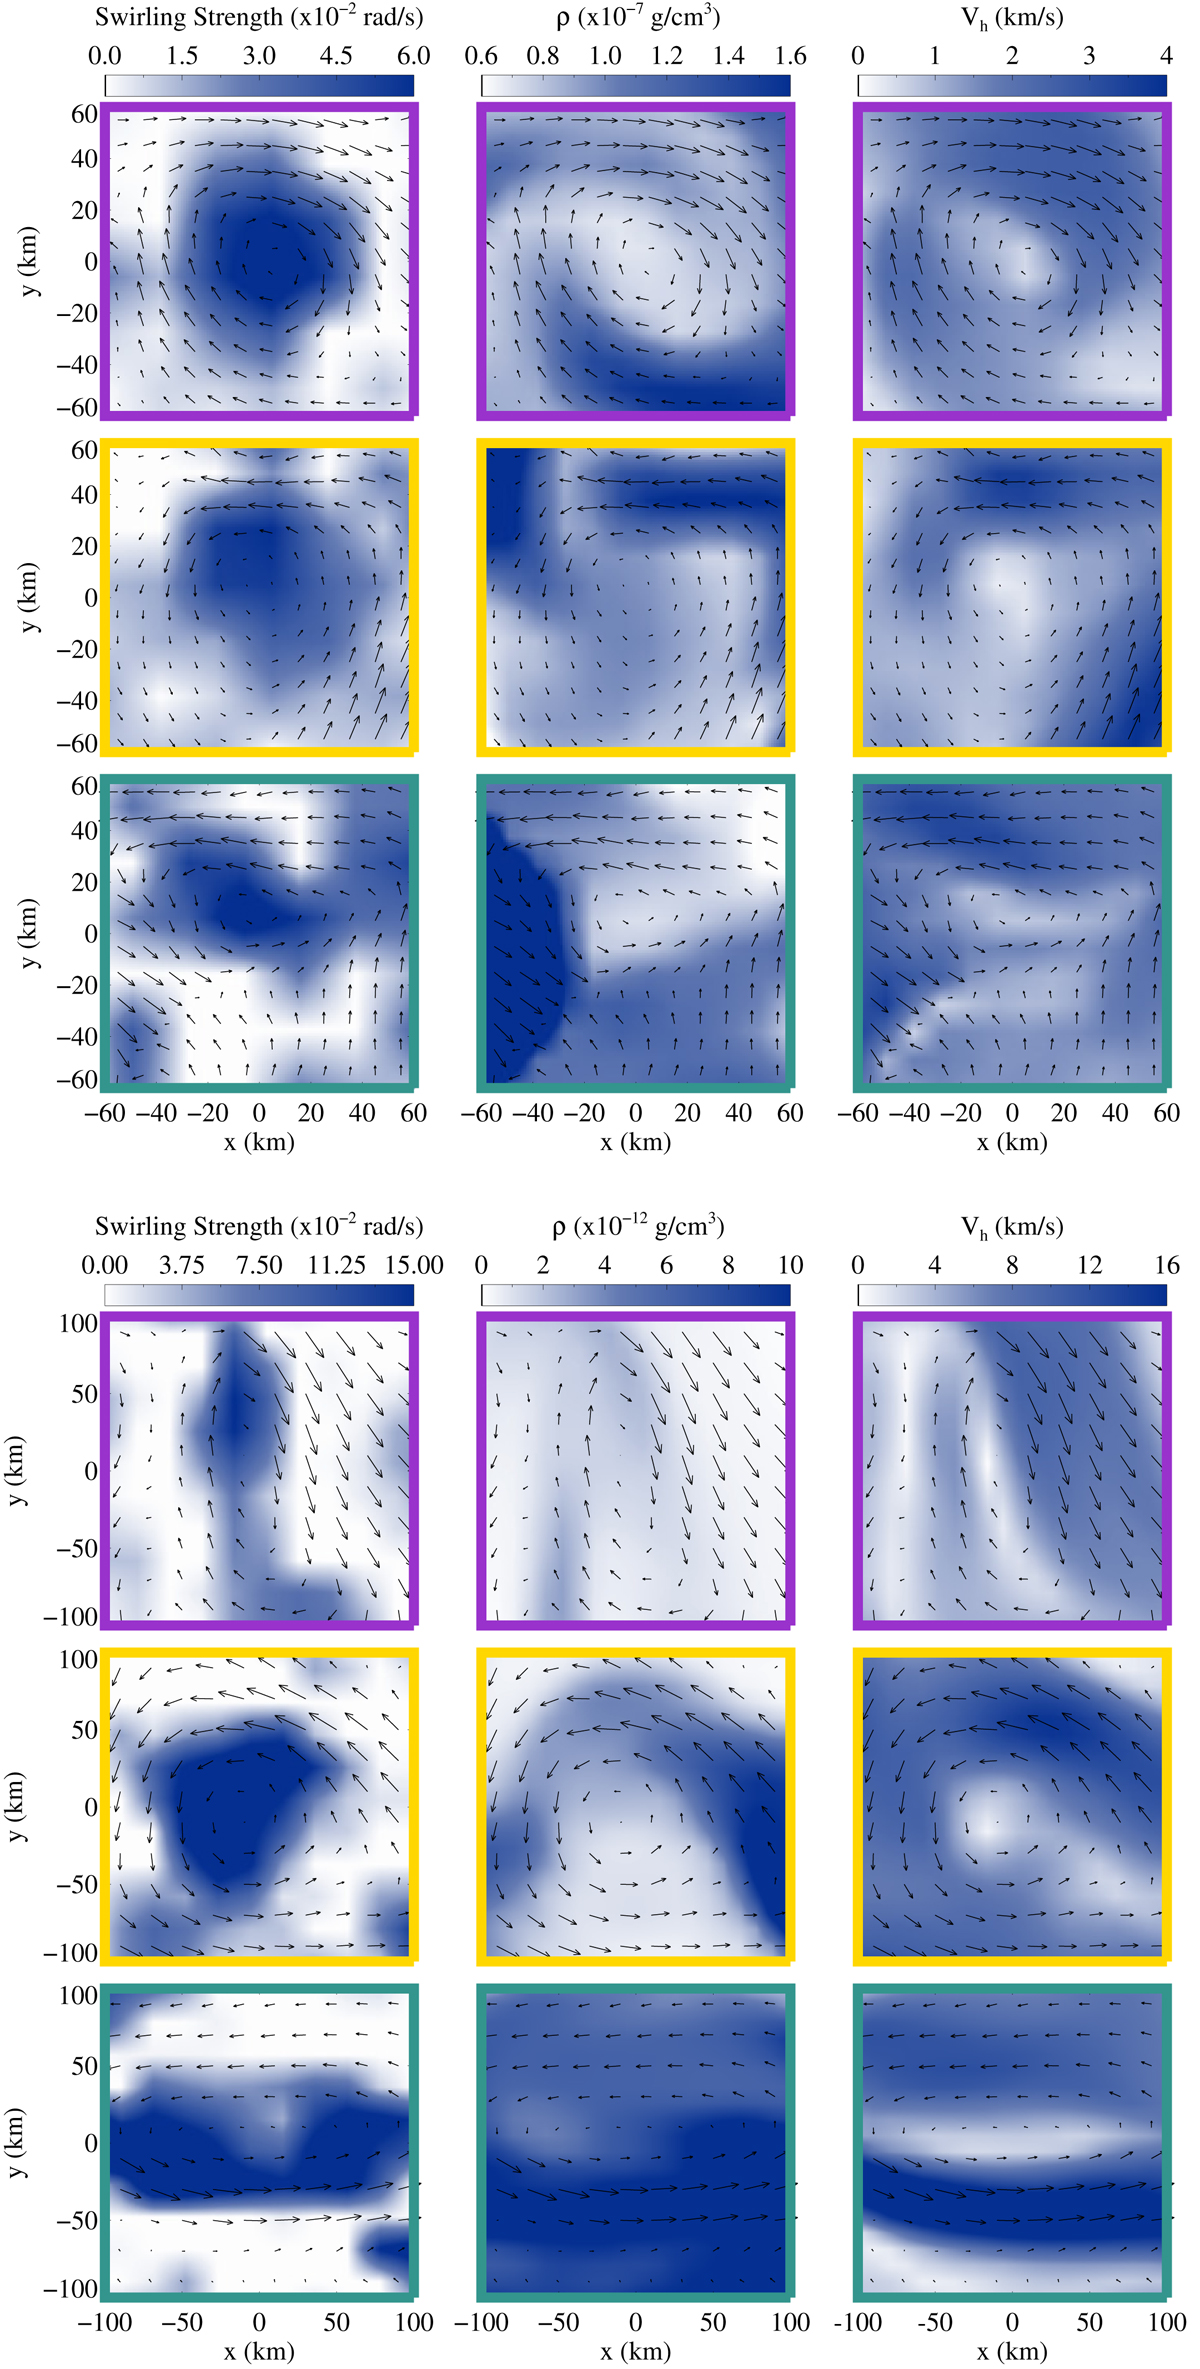
Left to right: profiles of swirling strength, mass density, and horizontal velocity for three vortices different rows with border colors corresponding to those of the squares outlining the vortices in Fig. 6 on the solar surface (rows 1–3) and at 1.5 Mm above the surface (rows 4–6). The overplotted arrows represent the horizontal velocity. The longest arrow corresponds to 4 km s−1 and 16 km s−1 in the photosphere and the chromosphere, respectively.
Current usage metrics show cumulative count of Article Views (full-text article views including HTML views, PDF and ePub downloads, according to the available data) and Abstracts Views on Vision4Press platform.
Data correspond to usage on the plateform after 2015. The current usage metrics is available 48-96 hours after online publication and is updated daily on week days.
Initial download of the metrics may take a while.