Fig. 5.
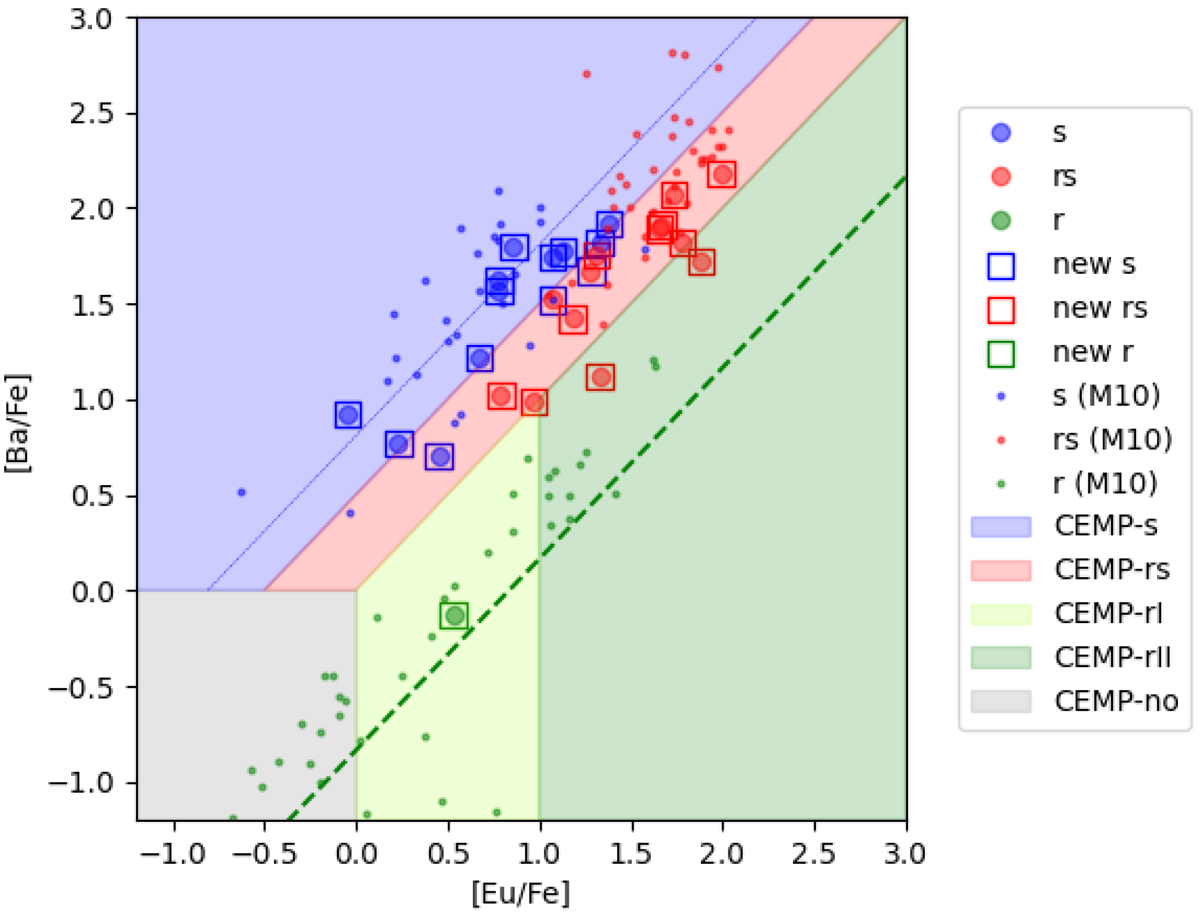
[Ba/Fe] as a function of [Eu/Fe]. CEMP-s stars, CEMP-rs stars, and an r-process enriched star studied in this paper are represented by blue, red, and green filled circles when adopting the original classification (Table 1, Orig. class.) and by large squares with the same colour-coding when adopting our new classification (Col. 9 of Table 1 and Sect. 5). The small dots represent objects compiled from the literature in Masseron et al. (2010). The dashed green line corresponds to abundance-ratio scaling with a pure solar r-process (Goriely 1999), whereas the continuous blue line corresponds to s-process nucleosynthesis abundance ratio scaling with the predictions for a 1.5 M⊙ star of [Fe/H] = −1 (5th pulse).
Current usage metrics show cumulative count of Article Views (full-text article views including HTML views, PDF and ePub downloads, according to the available data) and Abstracts Views on Vision4Press platform.
Data correspond to usage on the plateform after 2015. The current usage metrics is available 48-96 hours after online publication and is updated daily on week days.
Initial download of the metrics may take a while.