Fig. 3.
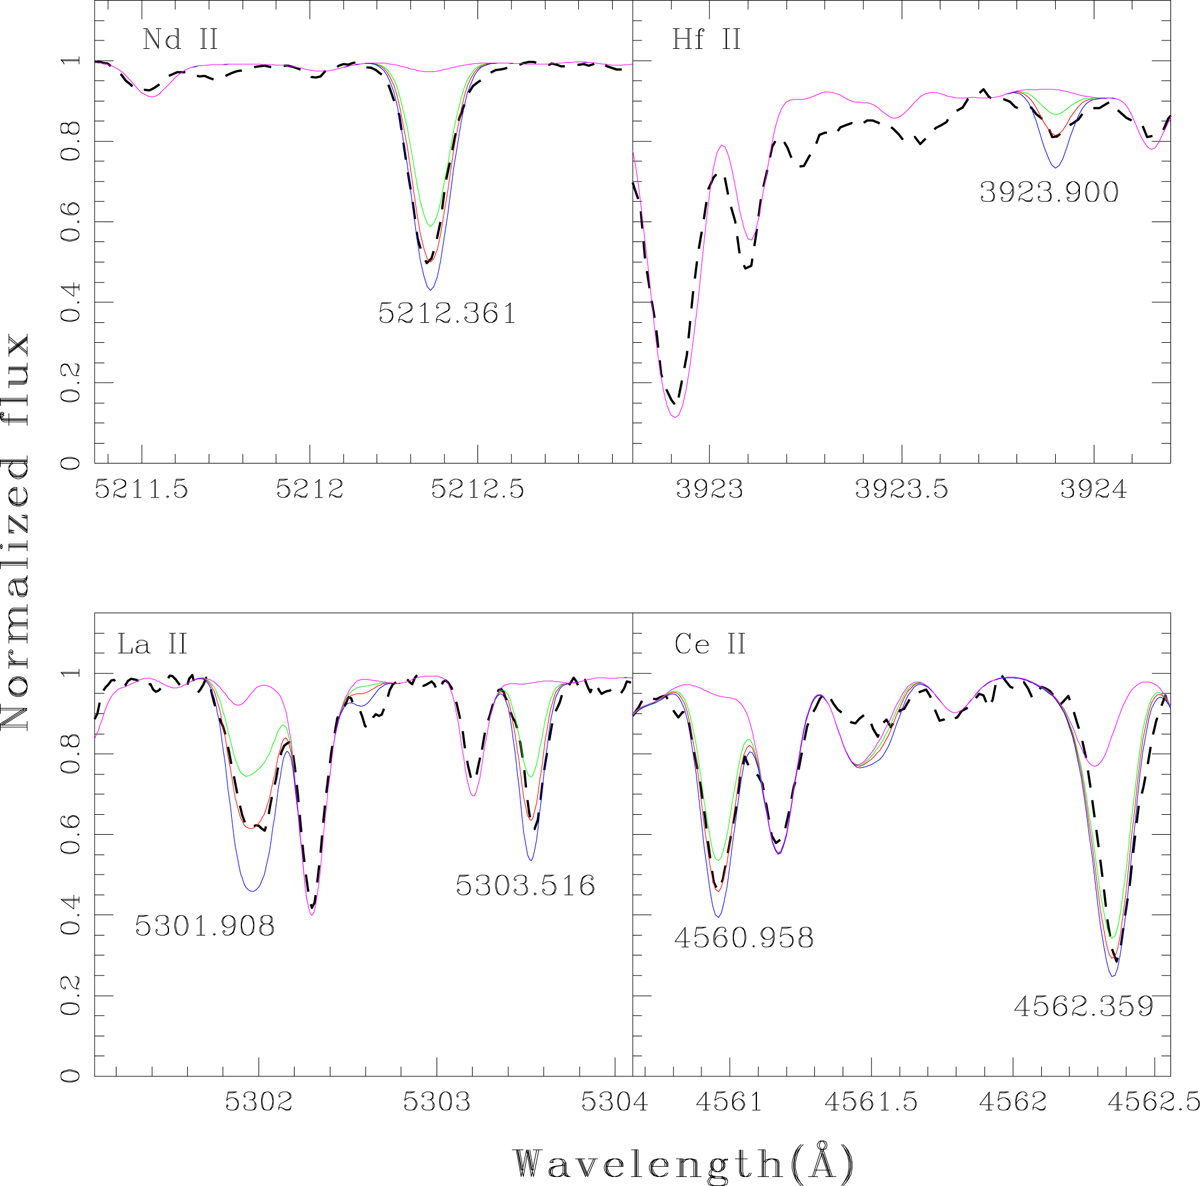
Spectral fitting of the La II and Ce II lines is shown for HD 198269 in the lower panel. Spectral synthesis of Nd II and Hf II is shown for HD 224959 in the upper panel. Red curves correspond to spectral syntheses with the adopted abundances for these elements, as listed in Table B.2. The blue and green curves correspond to syntheses with abundances deviating by ±0.3 dex from the adopted abundance. The black dashed line represents the observed spectrum. The magenta line corresponds to the synthesis with a null abundance for the corresponding element.
Current usage metrics show cumulative count of Article Views (full-text article views including HTML views, PDF and ePub downloads, according to the available data) and Abstracts Views on Vision4Press platform.
Data correspond to usage on the plateform after 2015. The current usage metrics is available 48-96 hours after online publication and is updated daily on week days.
Initial download of the metrics may take a while.