Fig. 20.
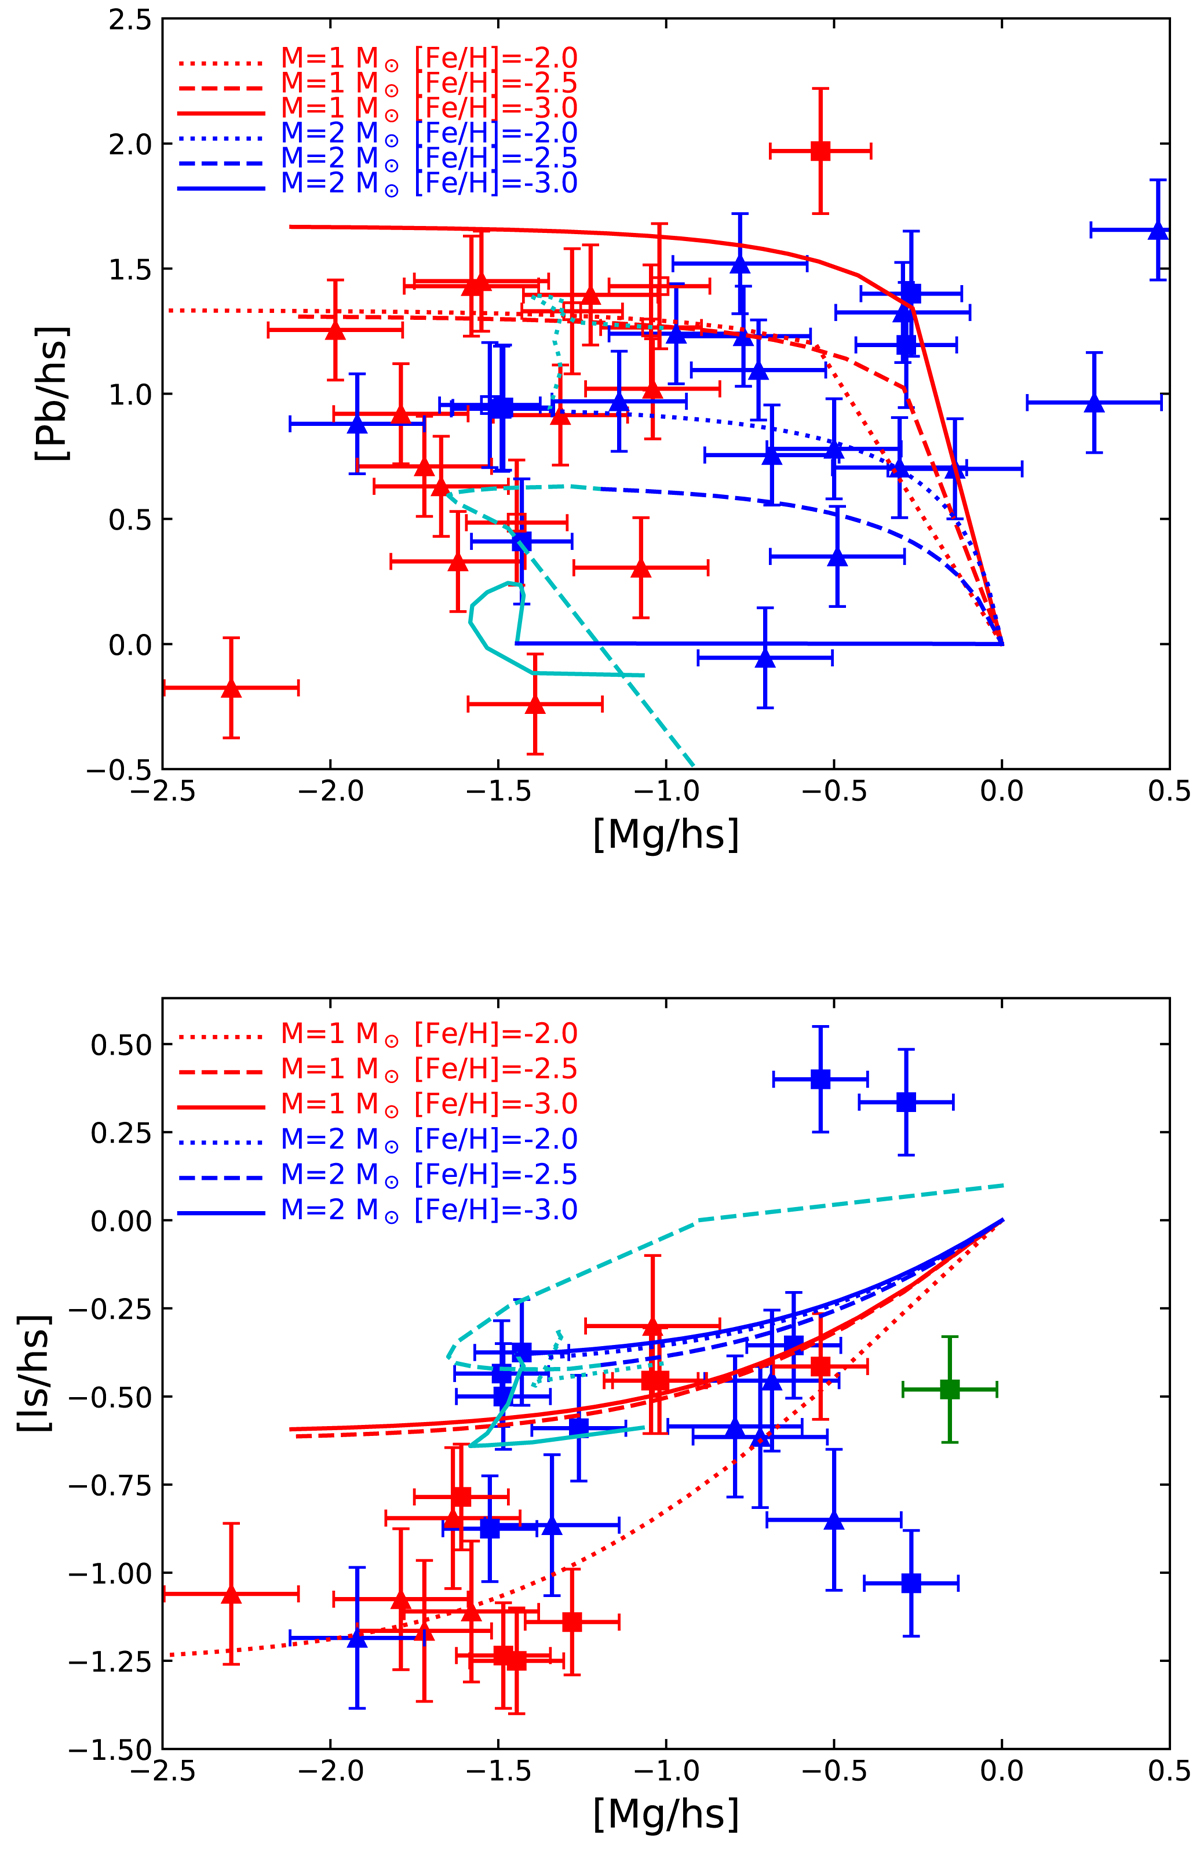
Abundances [Pb/hs] and [ls/hs] as a function of [Mg/hs], where [ls] = 1/2([Y/Fe]+[Zr/Fe]) and [hs/Fe] = 1/2([La/Fe]+[Ce/Fe]). The measured abundances are colour-coded as in Fig. 7, empty squares as in Fig. 15, and the model predictions as in Fig. 13. Blue and red triangles represent CEMP-s and CEMP-rs stars from the literature.
Current usage metrics show cumulative count of Article Views (full-text article views including HTML views, PDF and ePub downloads, according to the available data) and Abstracts Views on Vision4Press platform.
Data correspond to usage on the plateform after 2015. The current usage metrics is available 48-96 hours after online publication and is updated daily on week days.
Initial download of the metrics may take a while.