Fig. 2.
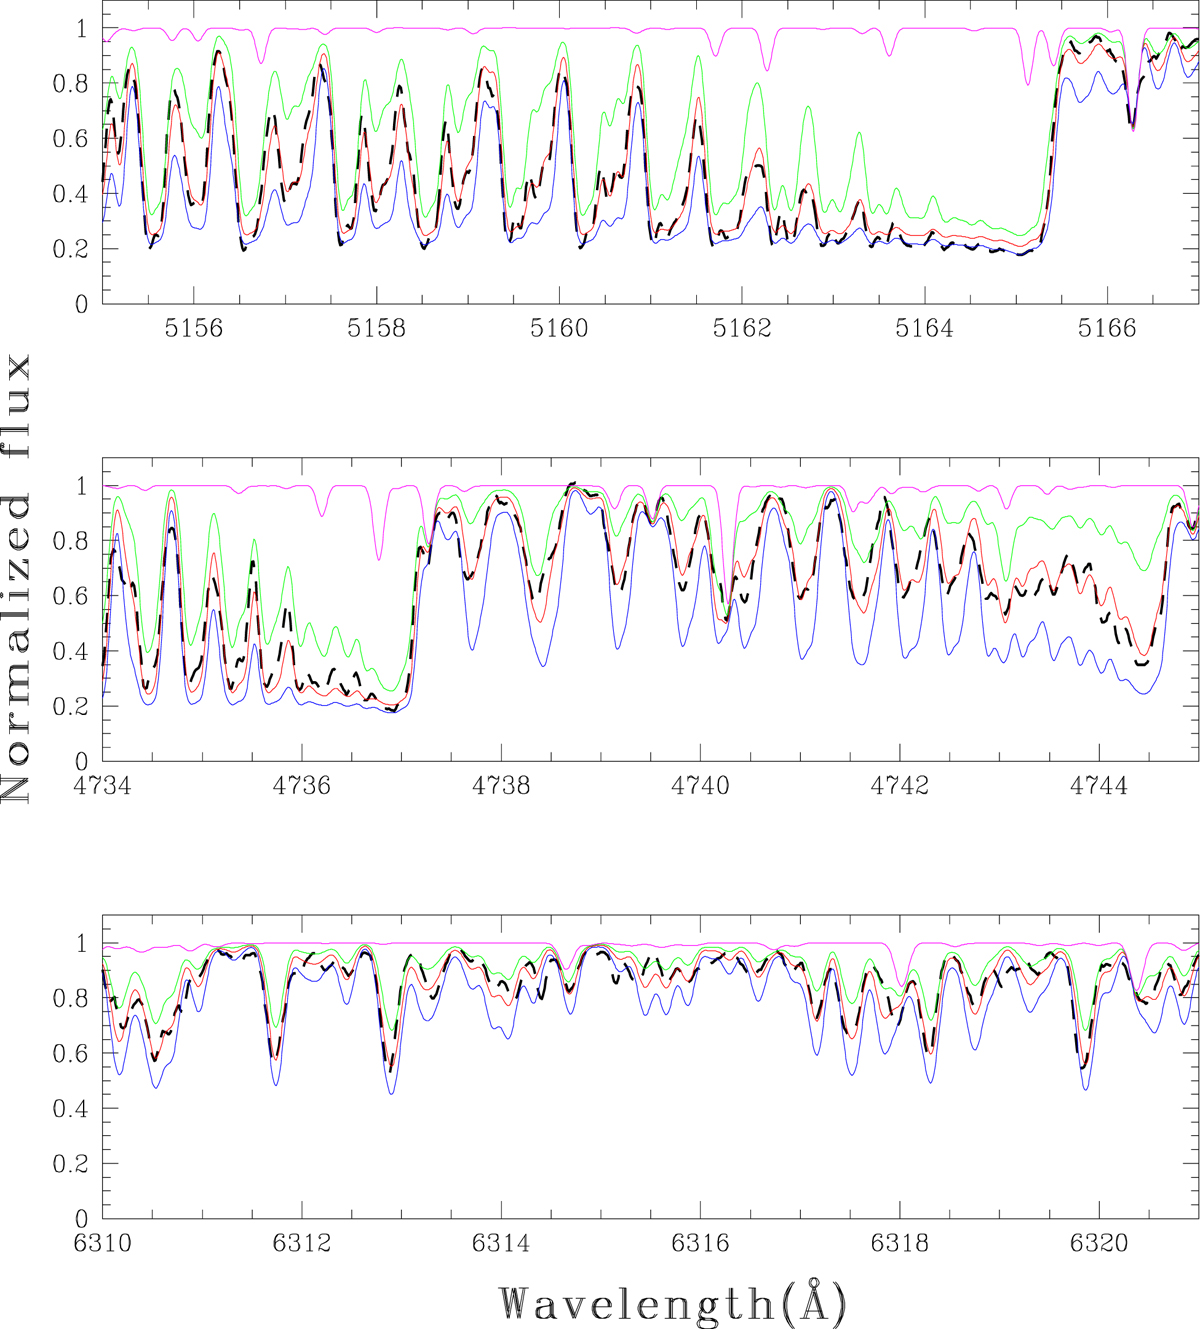
Spectral fits of the C2 and CN regions in HD 187861. Upper panel: C2 band around 5165 Å where the red curve represents the synthesis corresponding to the abundance log ϵC = 8.3, with ±0.3 dex on either side represented by the blue and green curves. The black dashed line corresponds to the observed spectrum and the magenta line to a spectral synthesis without carbon. Middle panel: spectral synthesis of the 12C12C feature at 4737 Å and the 12C13C feature at 4744 Å with the adopted C abundance and derived isotopic ratio of 16. The spectral synthesis of the CN band around 6315 Å is shown in the bottom panel with the adopted abundances of 8.3 and 7.85 for C and N, respectively.
Current usage metrics show cumulative count of Article Views (full-text article views including HTML views, PDF and ePub downloads, according to the available data) and Abstracts Views on Vision4Press platform.
Data correspond to usage on the plateform after 2015. The current usage metrics is available 48-96 hours after online publication and is updated daily on week days.
Initial download of the metrics may take a while.