Fig. 18.
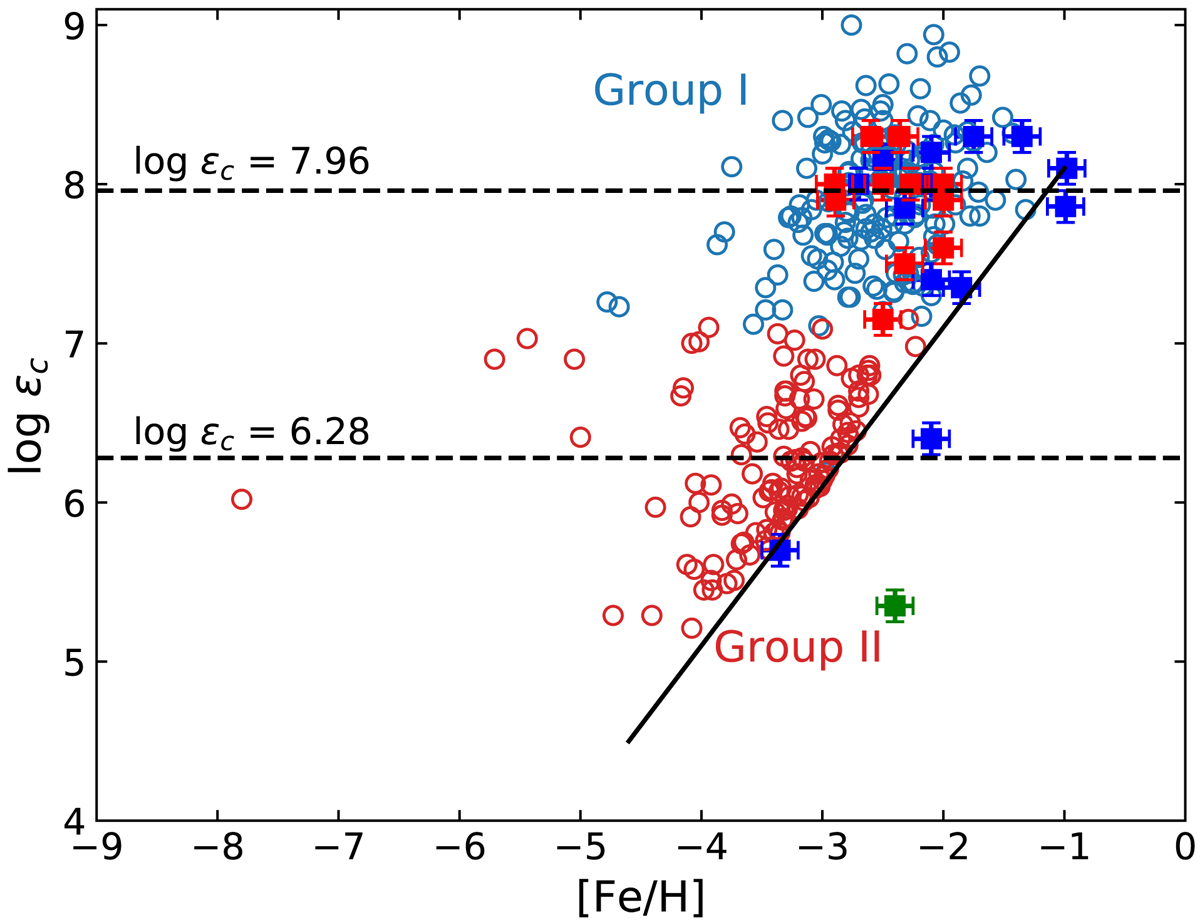
Scatter plot of the carbon abundance (log ϵC) as a function of metallicity. The diagonal line traces the Galactic evolution of carbon with metallicity, in the absence of any in situ enhancement. The stars in this sample are indicated by blue (CEMP-s) and red (CEMP-rs) squares. CEMP stars from the literature as compiled by Yoon et al. (2016) are superimposed: CEMP-s stars are represented as blue circles, they constitute Group I, with an average C abundance as indicated by the upper dashed horizontal line. CEMP-no stars are plotted as red circles, and define Group II.
Current usage metrics show cumulative count of Article Views (full-text article views including HTML views, PDF and ePub downloads, according to the available data) and Abstracts Views on Vision4Press platform.
Data correspond to usage on the plateform after 2015. The current usage metrics is available 48-96 hours after online publication and is updated daily on week days.
Initial download of the metrics may take a while.