Fig. 13.
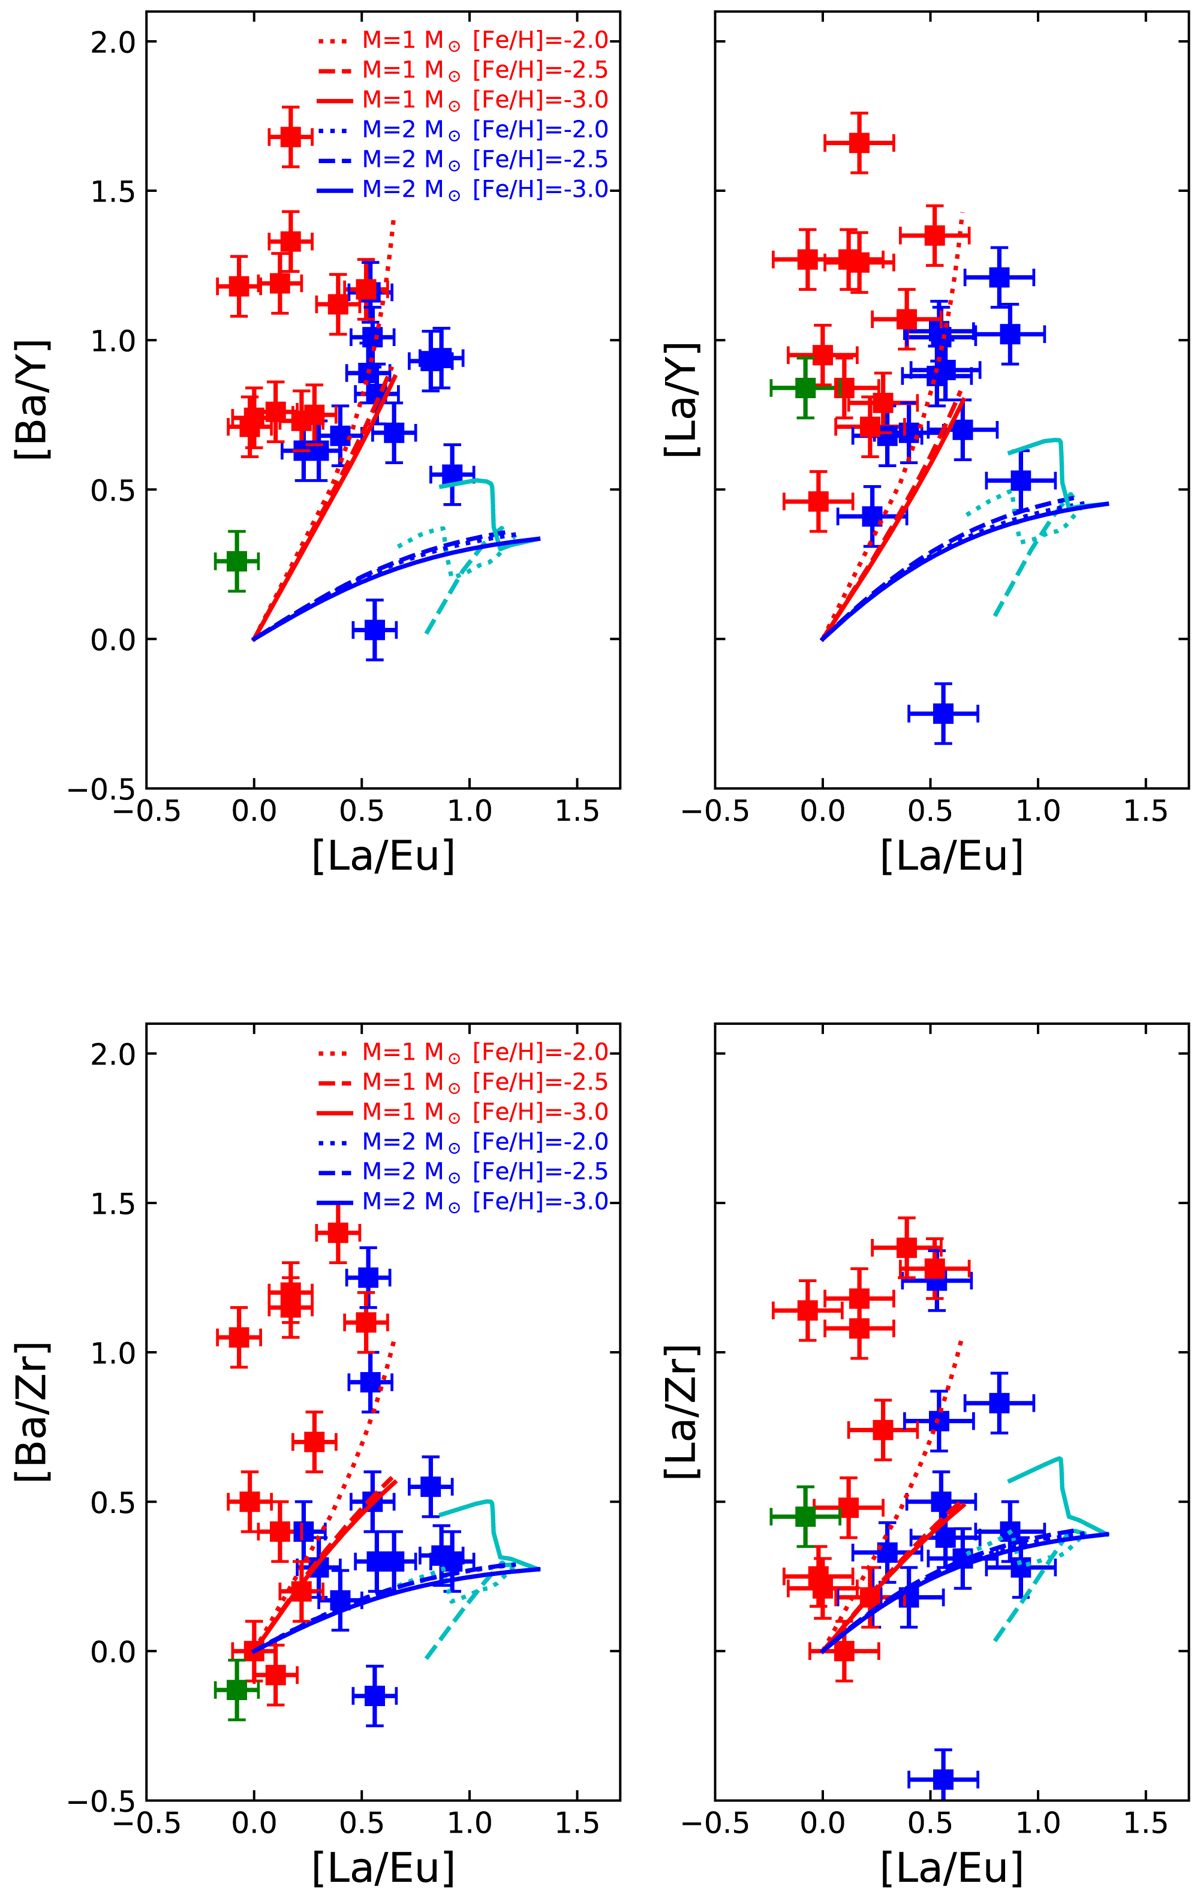
Four [hs/ls] indices (where ls = Zr or Y, and hs = Ba or La) as a function of the [s/r] index [La/Eu]. Symbols are as in Fig. 7. Theoretical predictions for 1 and 2 M⊙ AGB stars at different metallicities, as labelled, are overplotted. For the 2 M⊙ models the cyan line represents the evolution of the abundances along the AGB, whereas the blue and red lines represents the dilution of tip-of-the-AGB material in the envelope of the companion, ultimately producing material of solar abundance ([Ba/Zr] = 0, [La/Eu] = 0, [La/Zr] = 0). Since the 1 M⊙ models experience a single thermal pulse, the cyan line reduces to a single point in that case and the red lines represent the mere dilution as above for the blue lines. We note that the 1 M⊙ model predictions at [Fe/H] = −2.5 and −3 almost exactly superimpose.
Current usage metrics show cumulative count of Article Views (full-text article views including HTML views, PDF and ePub downloads, according to the available data) and Abstracts Views on Vision4Press platform.
Data correspond to usage on the plateform after 2015. The current usage metrics is available 48-96 hours after online publication and is updated daily on week days.
Initial download of the metrics may take a while.