Fig. 1.
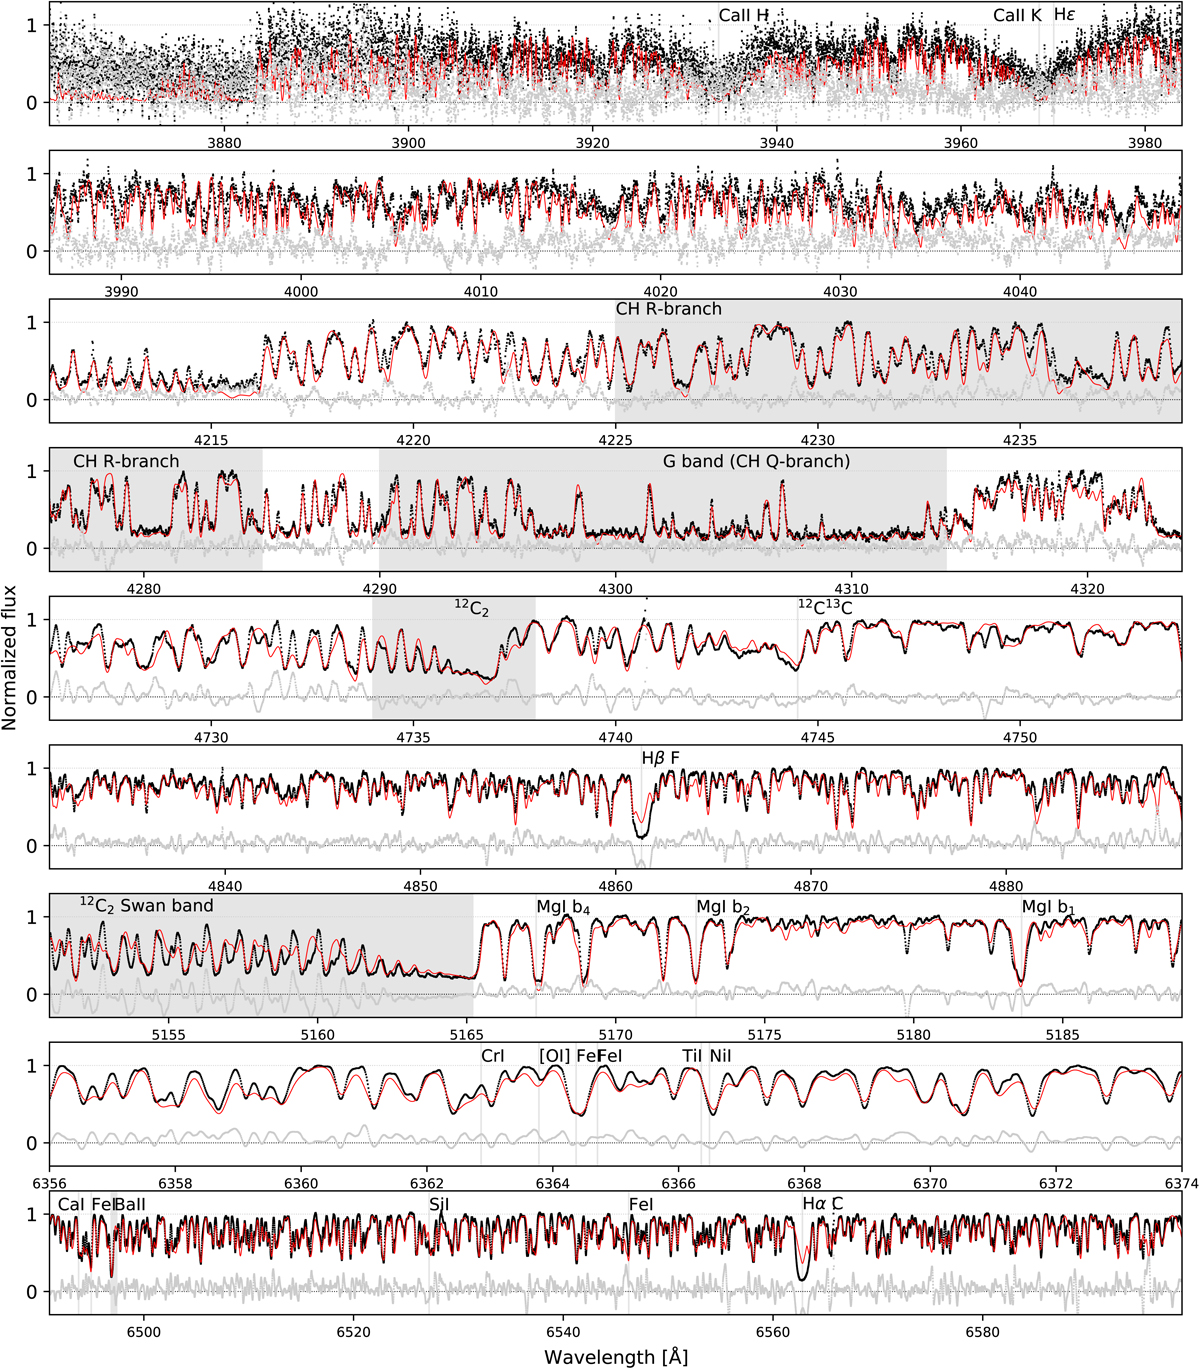
Spectral fitting of HE 1120−2122 using KASTEEL. Different spectral regions used to fine-tune the atmospheric parameters are illustrated. The black dots represent the normalized observed flux, the red line corresponds to the synthetic fluxes, and the grey dots are the residuals. The shaded areas correspond to molecular bands, as labelled.
Current usage metrics show cumulative count of Article Views (full-text article views including HTML views, PDF and ePub downloads, according to the available data) and Abstracts Views on Vision4Press platform.
Data correspond to usage on the plateform after 2015. The current usage metrics is available 48-96 hours after online publication and is updated daily on week days.
Initial download of the metrics may take a while.