Free Access
Fig. 16.
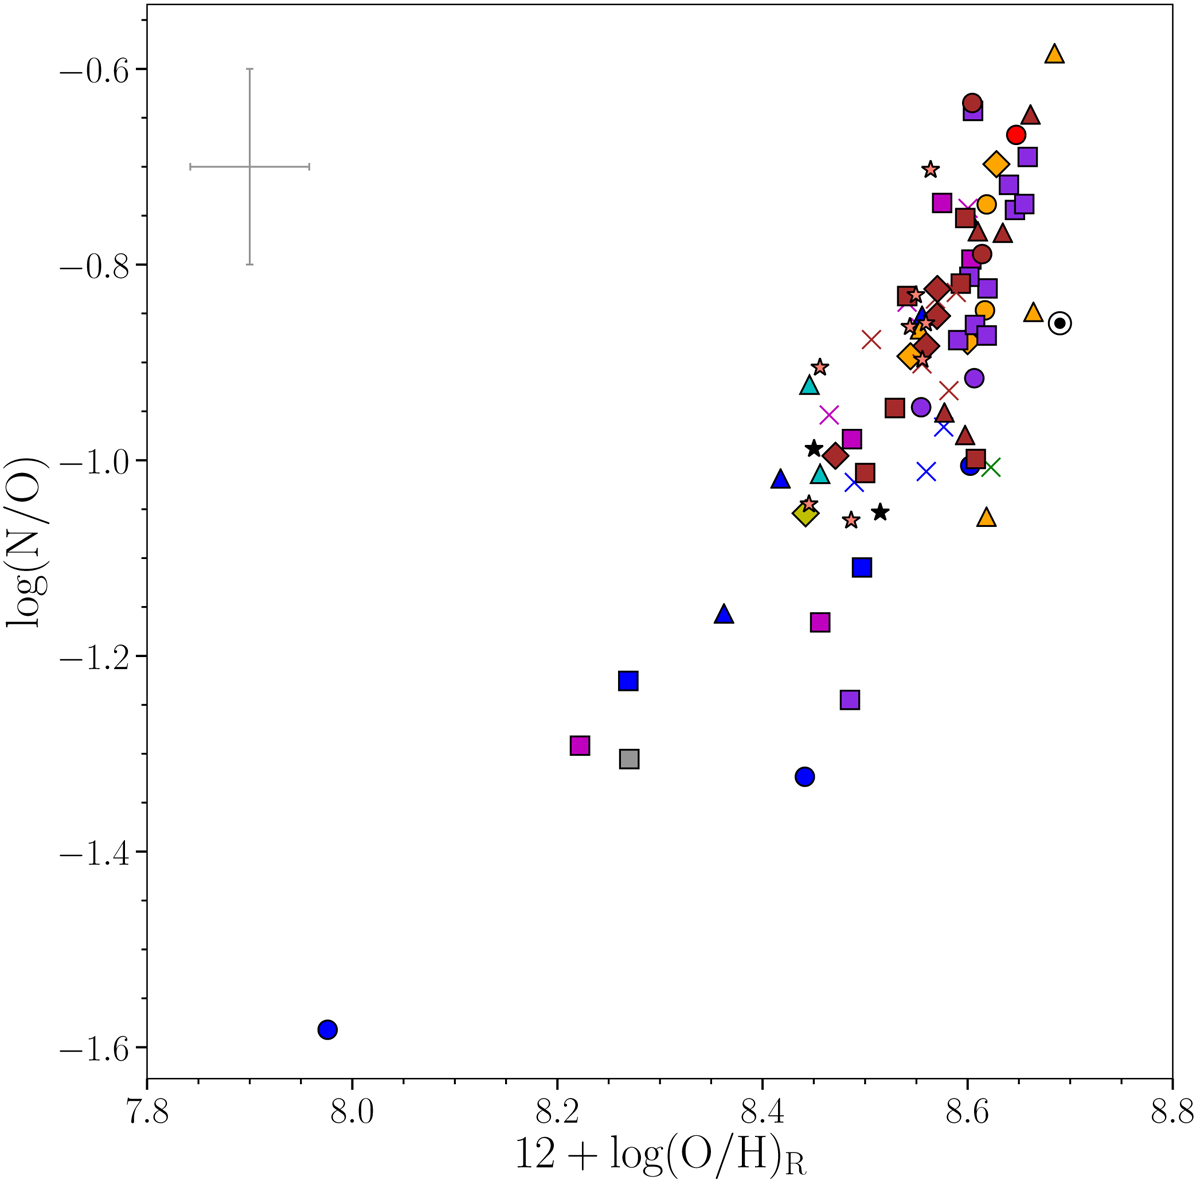
Relation between log(N/O) and 12+log(O/H)R. All the points in the figures have the same colours and markers as Fig. 3. The upper left cross indicates the typical error of both parameters. The marker ⊙ shows the position of the solar value in this diagram.
Current usage metrics show cumulative count of Article Views (full-text article views including HTML views, PDF and ePub downloads, according to the available data) and Abstracts Views on Vision4Press platform.
Data correspond to usage on the plateform after 2015. The current usage metrics is available 48-96 hours after online publication and is updated daily on week days.
Initial download of the metrics may take a while.