Fig. 14.
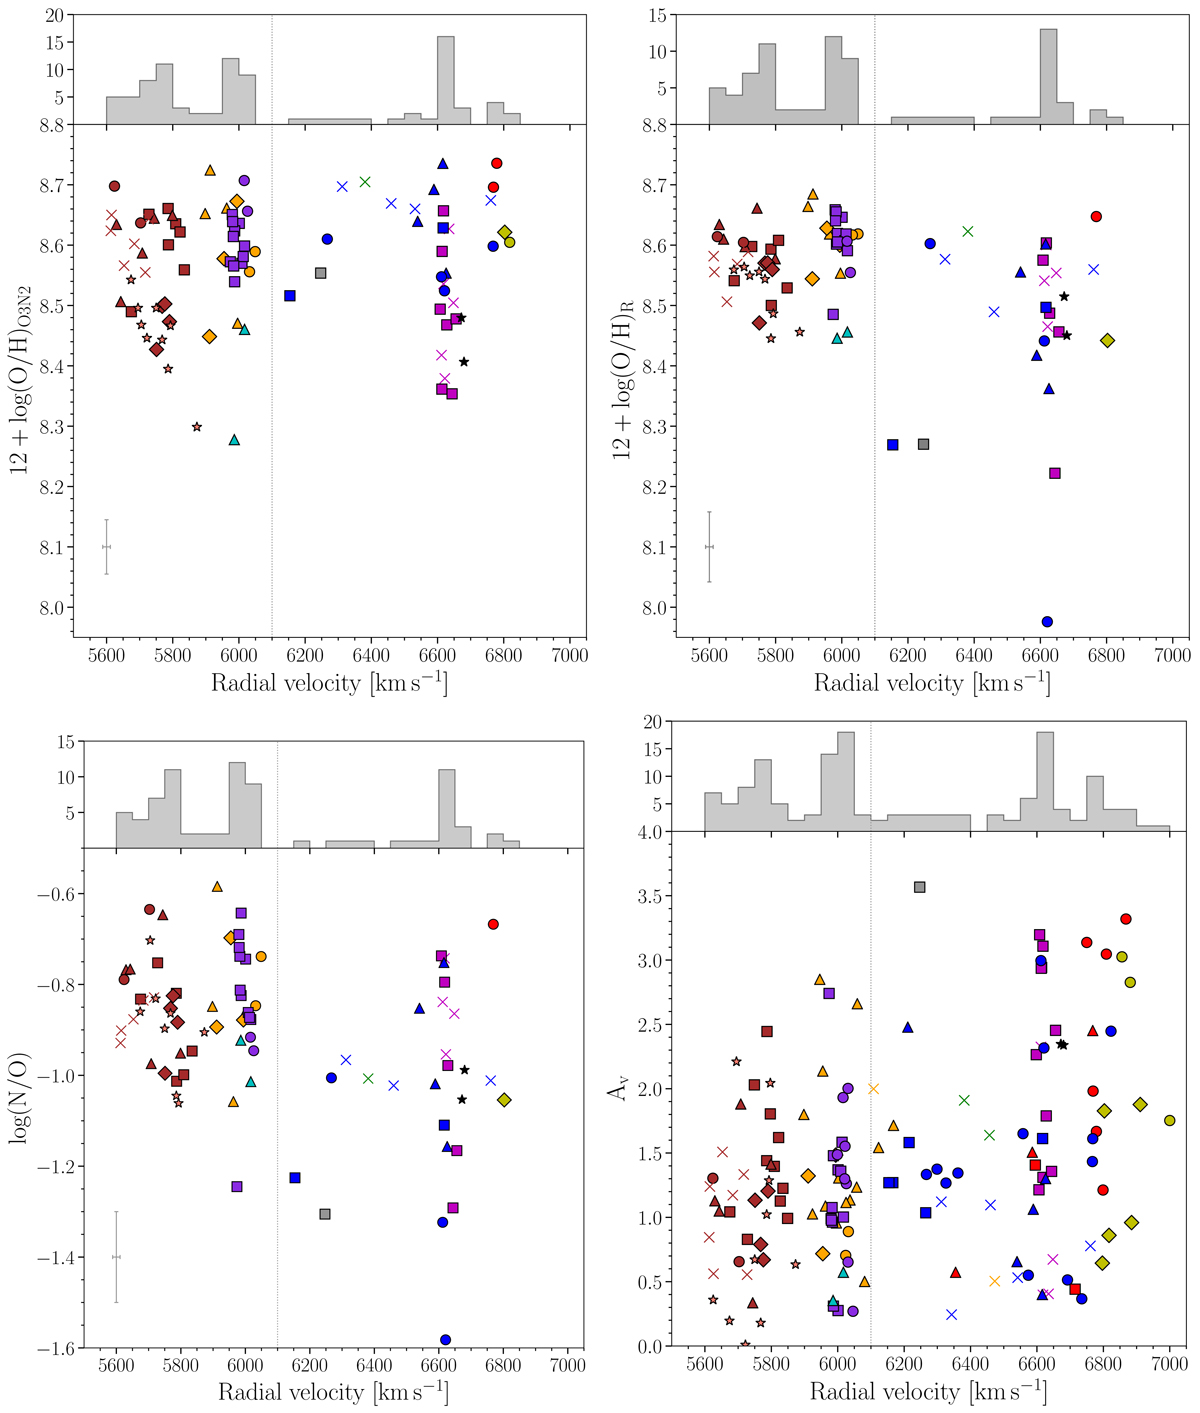
(i) Upper left panel: relation between 12+log(O/H)O3N2 and radial velocity for the HII regions; (ii) upper right panel: relation between 12+log(O/H)R and radial velocity for the HII regions; (iii) lower left panel: relation between log(N/O) and radial velocity for the HII regions; (iv) lower right panel: relation between Av and radial velocity for the Hα emission regions. All the points in the figures have the same colours and markers as Fig. 3. The vertical black dashed line corresponds to the value at radial velocity = 6100 km s−1. Above each figure its distribution of the radial velocity for the SQ HII regions is represented. The lower left crosses indicate the typical error of the two parameters.
Current usage metrics show cumulative count of Article Views (full-text article views including HTML views, PDF and ePub downloads, according to the available data) and Abstracts Views on Vision4Press platform.
Data correspond to usage on the plateform after 2015. The current usage metrics is available 48-96 hours after online publication and is updated daily on week days.
Initial download of the metrics may take a while.