Fig. 8.
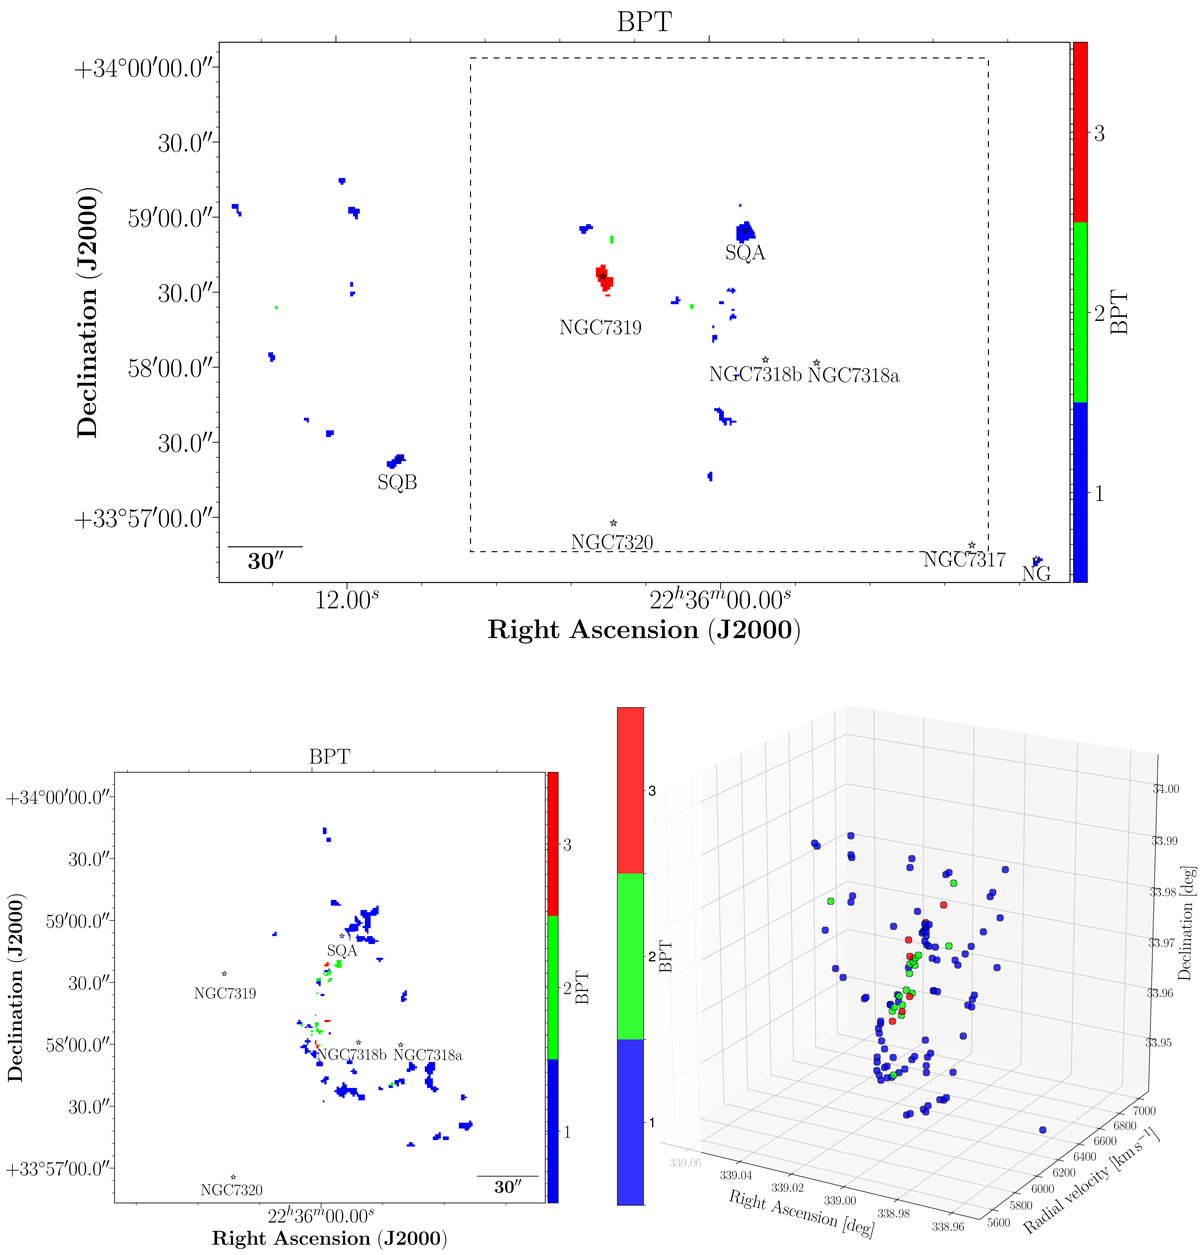
Stephan’s Quintet spatial map colour coded according to their position in the BPT diagnostic diagram for the HV sub-sample (upper panel), the LV sub-sample (lower left panel), and the three-dimensional distribution of the BPT class (α, δ, radial velocity; lower right panel). Blue, green, and red pixels represent star-forming (1), composite (2), and AGN-like (3) regions, respectively.
Current usage metrics show cumulative count of Article Views (full-text article views including HTML views, PDF and ePub downloads, according to the available data) and Abstracts Views on Vision4Press platform.
Data correspond to usage on the plateform after 2015. The current usage metrics is available 48-96 hours after online publication and is updated daily on week days.
Initial download of the metrics may take a while.