Free Access
Fig. 8
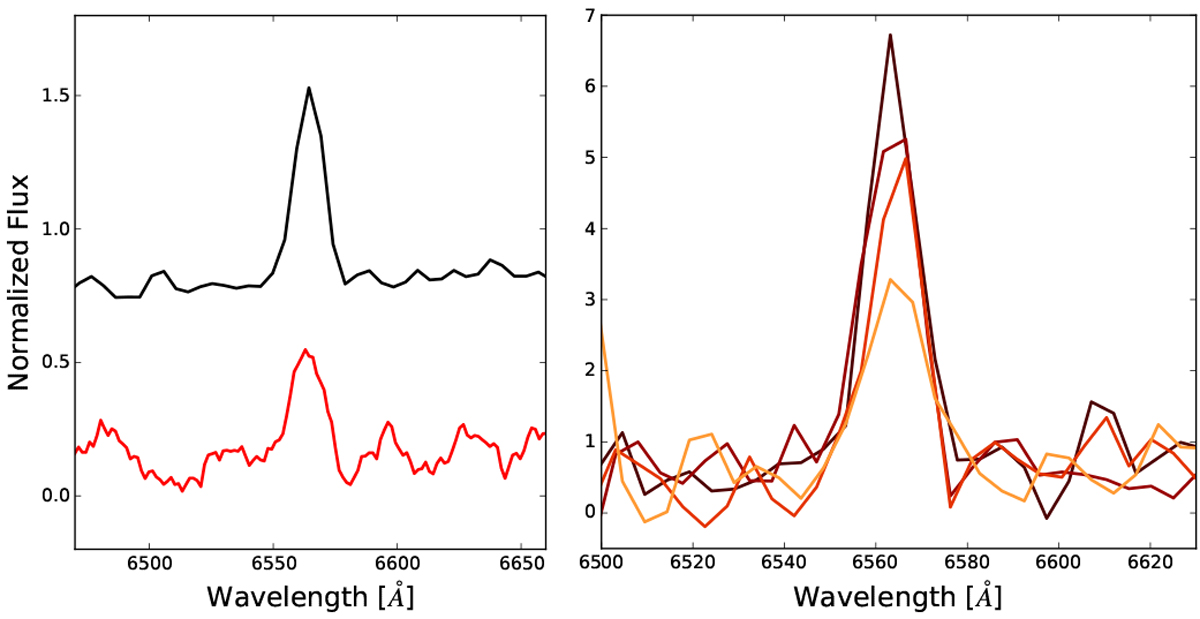
Variation in the Hα emission line. Left panel: Hα line inour GTC/OSIRIS spectrum (black) compared with the eBOSS spectrum (red). The eBOSS spectrum has been smoothed for a better visualisation. Right panel: Hα line extracted from the four GTC/OSIRIS individual exposures separately.
Current usage metrics show cumulative count of Article Views (full-text article views including HTML views, PDF and ePub downloads, according to the available data) and Abstracts Views on Vision4Press platform.
Data correspond to usage on the plateform after 2015. The current usage metrics is available 48-96 hours after online publication and is updated daily on week days.
Initial download of the metrics may take a while.