Fig. 22.
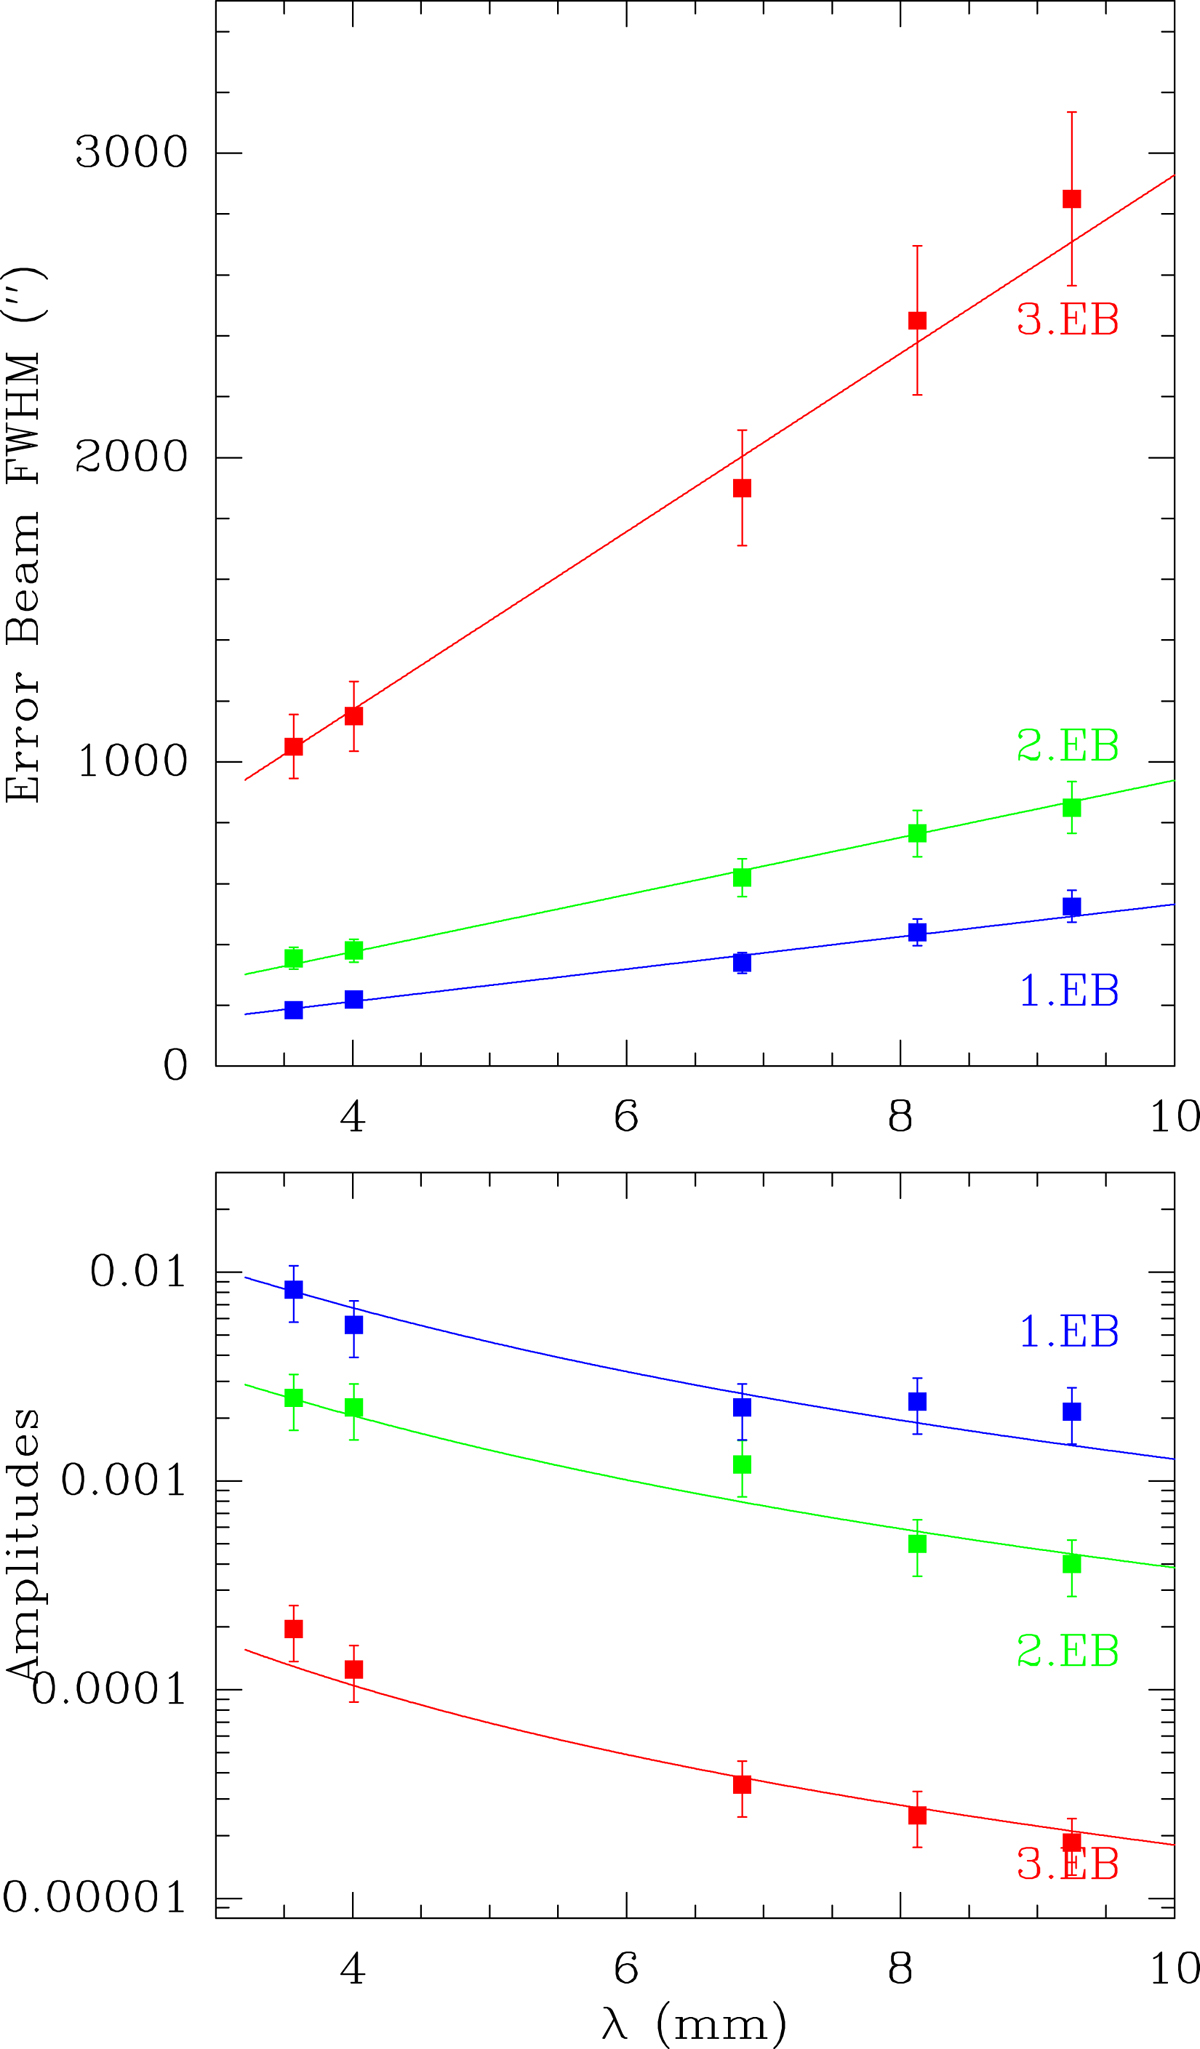
Best-fit values (solid squares) of the widths (upper panel) and amplitudes (bottom panel) of the error beams. Solid lines fit these values to Eq. (14) (upper panel) and Eq. (15) (bottom panel) in order to obtain the correlation length (L) and the RMS value of the surface errors (σ). For a more detailed explanation, see Sect. 6.4.
Current usage metrics show cumulative count of Article Views (full-text article views including HTML views, PDF and ePub downloads, according to the available data) and Abstracts Views on Vision4Press platform.
Data correspond to usage on the plateform after 2015. The current usage metrics is available 48-96 hours after online publication and is updated daily on week days.
Initial download of the metrics may take a while.