Fig. 18.
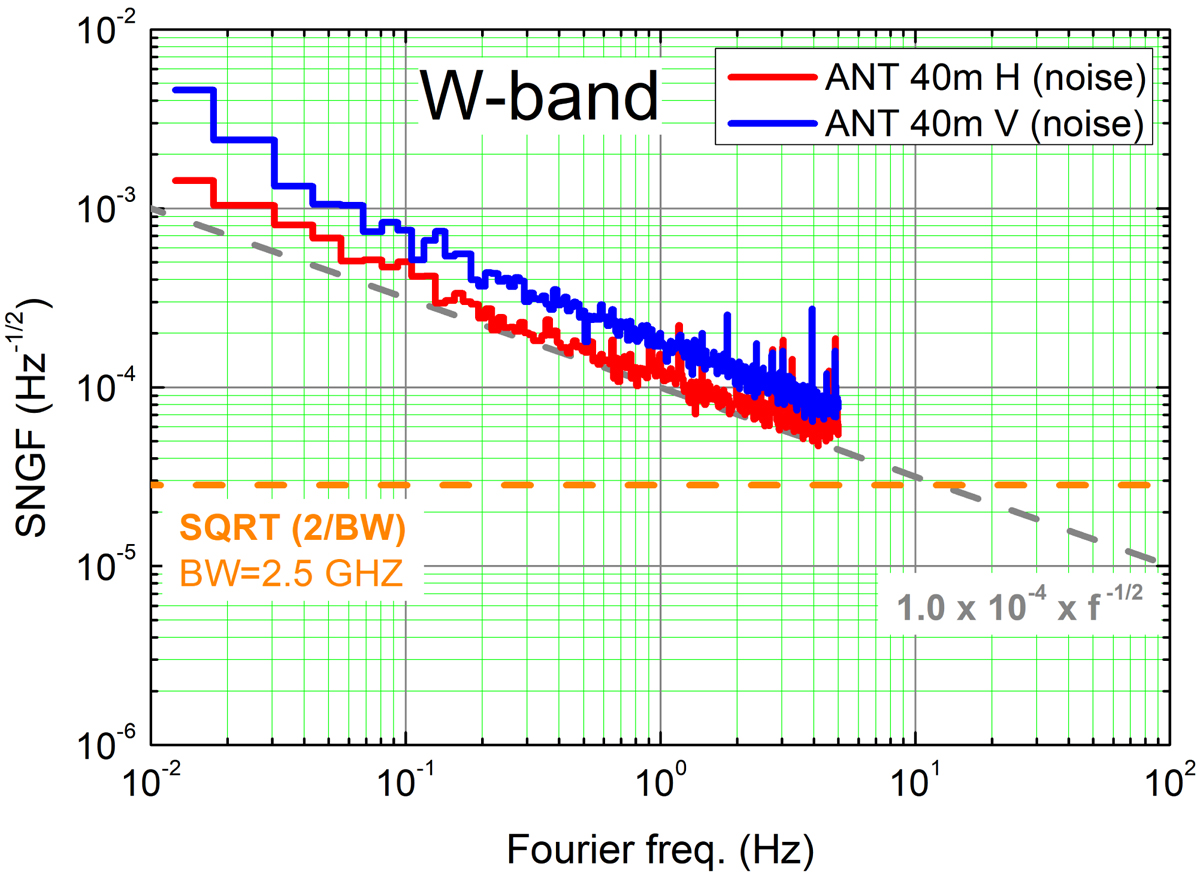
Spectrum of normalised gain fluctuations of the complete W band receiver for both polarisations (red and blue curves). The dashed grey line corresponds to an ideal ∝f−1/2 fluctuation. The dashed orange line shows the fluctuation level for ideal radiometer white noise in a 2.5 GHz bandwidth. See Sect. 3.3 for a more detailed explanation.
Current usage metrics show cumulative count of Article Views (full-text article views including HTML views, PDF and ePub downloads, according to the available data) and Abstracts Views on Vision4Press platform.
Data correspond to usage on the plateform after 2015. The current usage metrics is available 48-96 hours after online publication and is updated daily on week days.
Initial download of the metrics may take a while.