Free Access
Fig. 15.
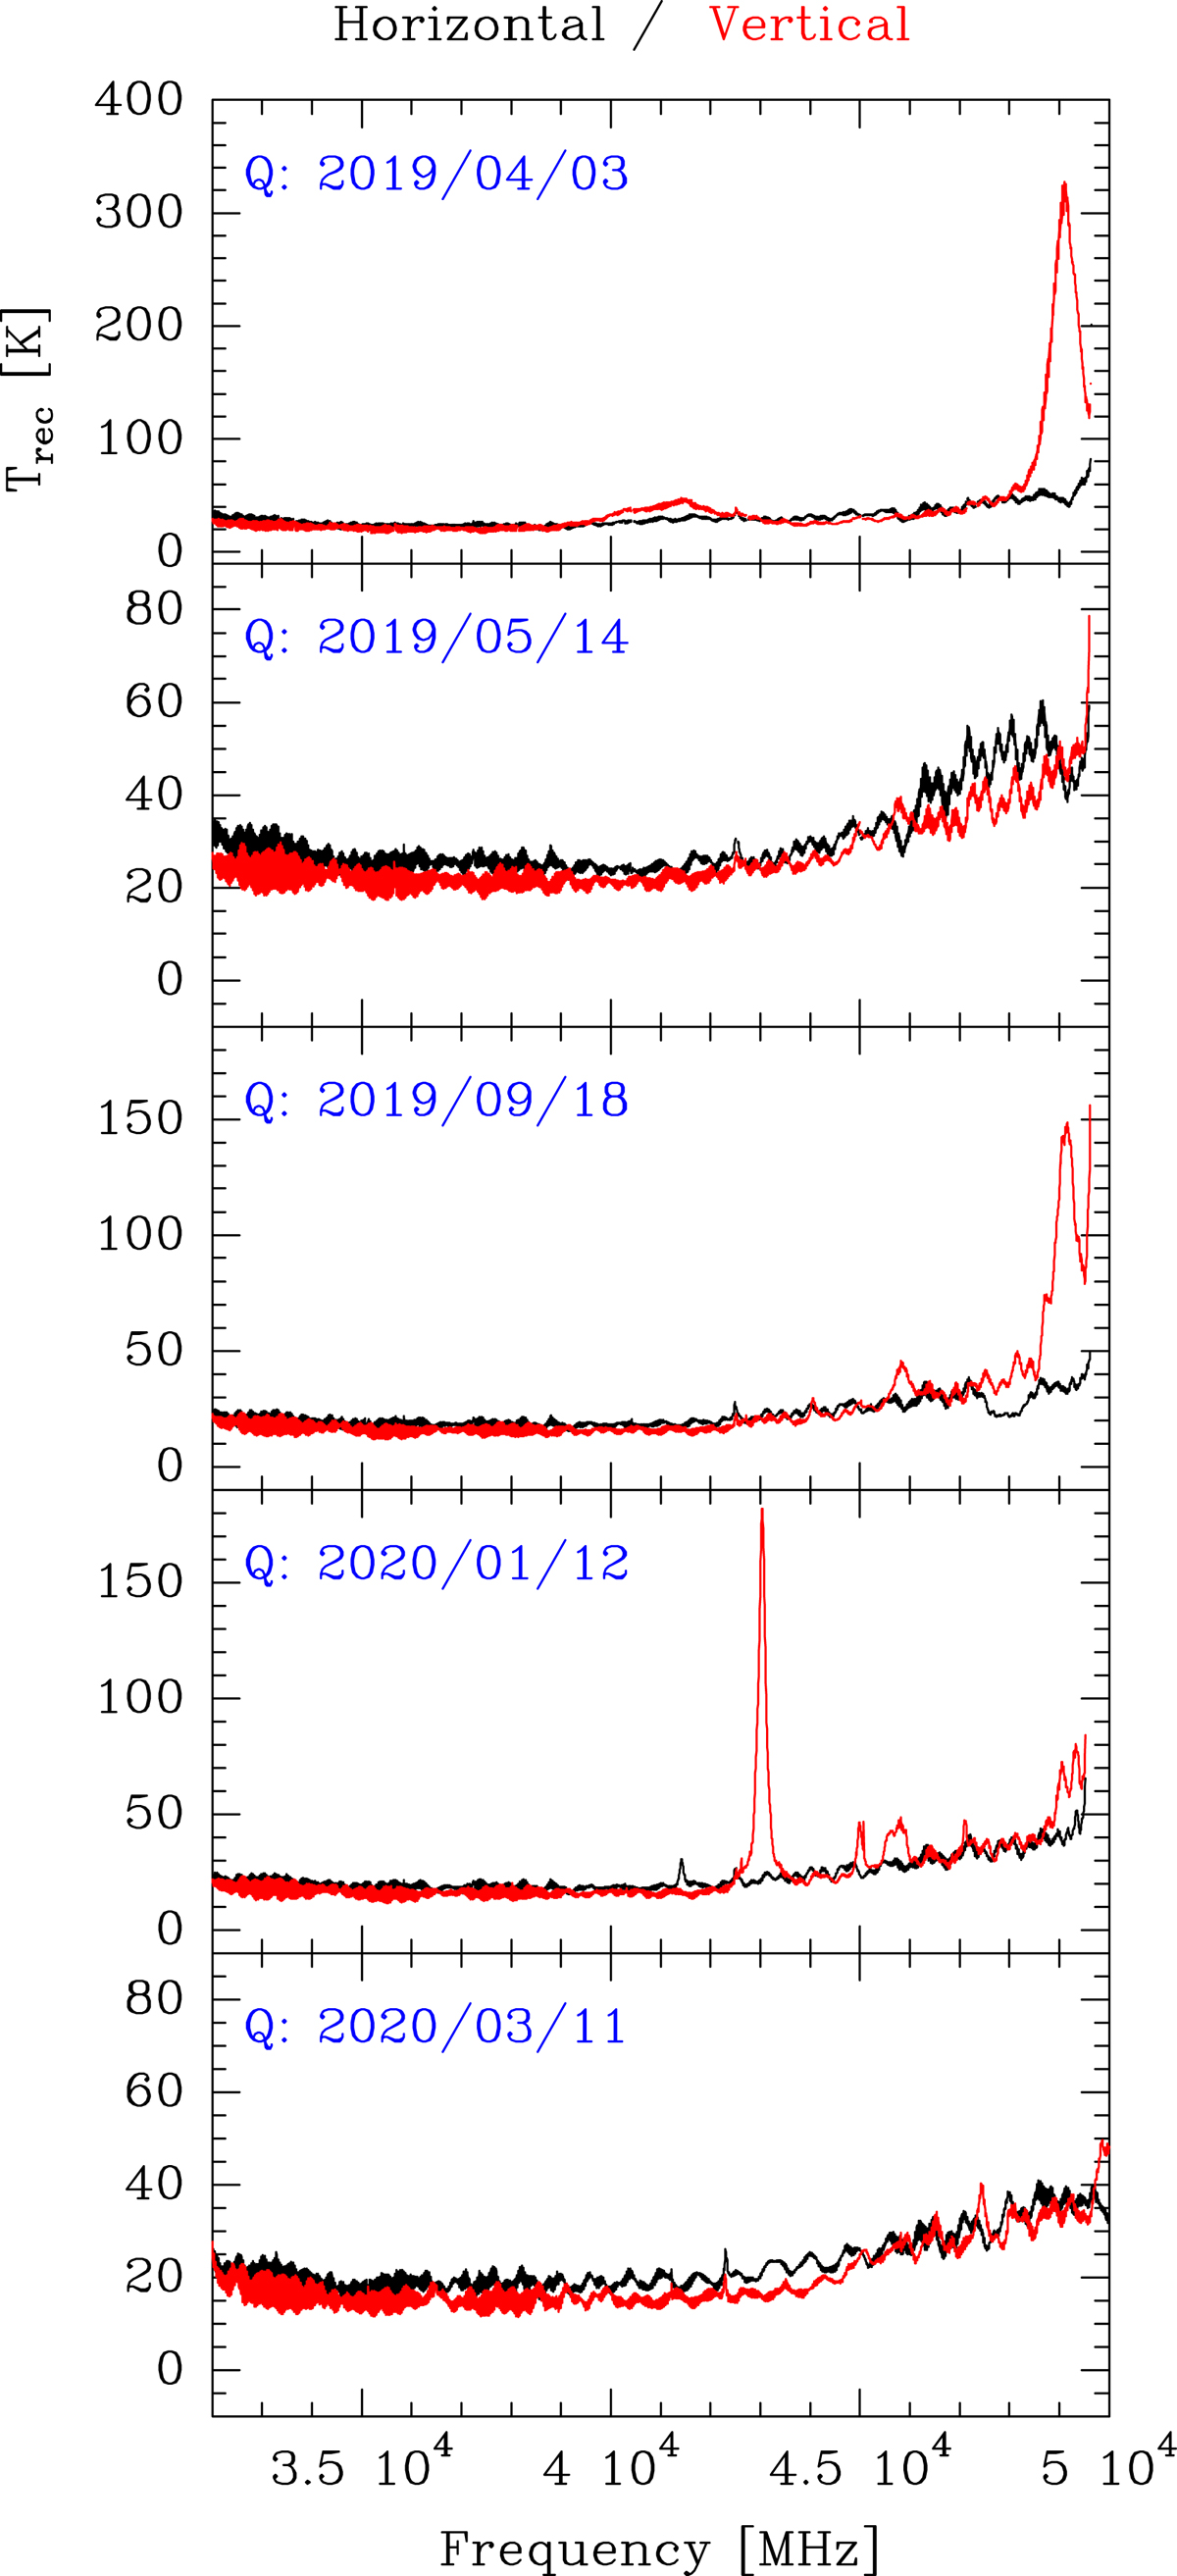
Receiver temperature of the Q band receiver installed at the 40 m telescope at different dates (see Sect. 3.1). These measurements alerted us to the existence of problems in the system and helped us to discover its origin.
Current usage metrics show cumulative count of Article Views (full-text article views including HTML views, PDF and ePub downloads, according to the available data) and Abstracts Views on Vision4Press platform.
Data correspond to usage on the plateform after 2015. The current usage metrics is available 48-96 hours after online publication and is updated daily on week days.
Initial download of the metrics may take a while.