Fig. 8.
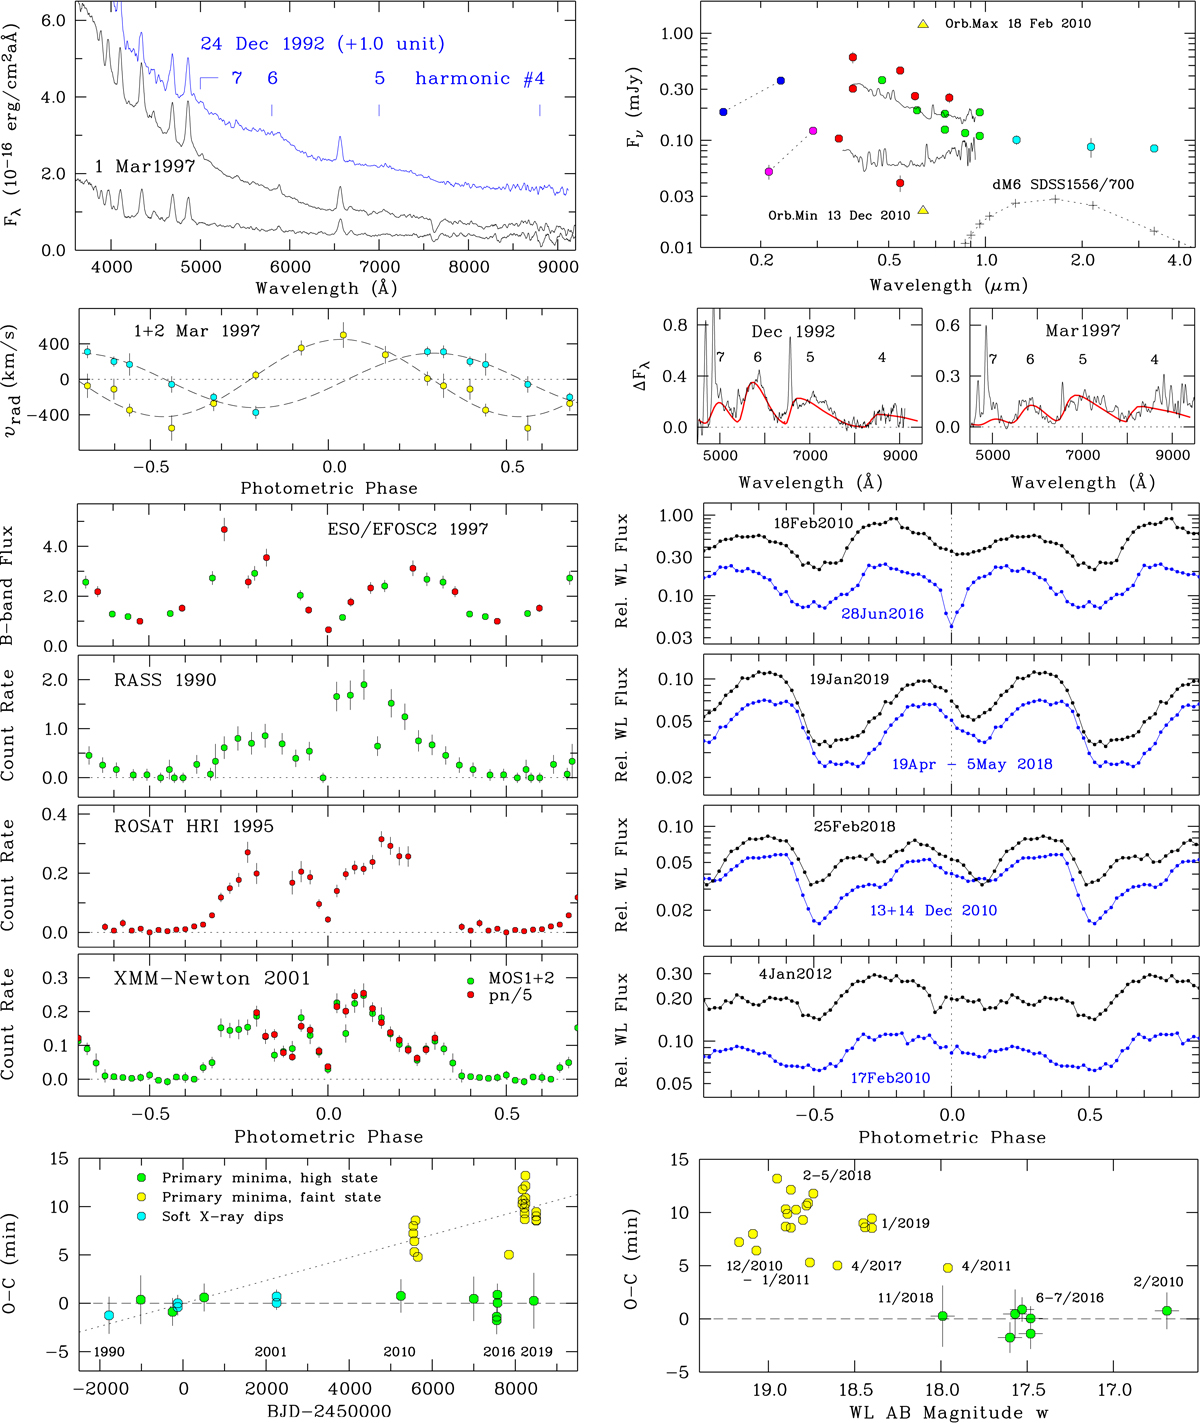
RX J1002.2–1925. Left, top: flux-calibrated low-resolution spectra on 24 December 1992 and at orbital maximum and minimum on 1 March 1997. Cyclotron harmonics are indicated. Left, second from top: Balmer-line radial velocities of the narrow and broad components from spectra of 1 and 2 March 1997. Left, third from top: spectral flux in the B band of 1 and 2 March 1997 in units is 10−16 ergs cm−2 s−1 Å−1. Left, next three panels: soft X-ray light curves of 1990, 1995, and 2001. Right, top: overall nonsimultaneous SED. Right, second from top: cyclotron spectra on 24 December 1992 and 1 March 1997 with models for a field strength of 33 MG. Right, next four panels: samples of optical light curves taken in WL, illustrating the variability of primary and secondary minima. Left, bottom: O − C diagram for the primary minimum, from light curves with peak orbital WL AB magnitude w ≲ 18. Right, bottom: O−C for the primary minimum vs. w. The photometric phase is from Eq. (8).
Current usage metrics show cumulative count of Article Views (full-text article views including HTML views, PDF and ePub downloads, according to the available data) and Abstracts Views on Vision4Press platform.
Data correspond to usage on the plateform after 2015. The current usage metrics is available 48-96 hours after online publication and is updated daily on week days.
Initial download of the metrics may take a while.