Fig. 7.
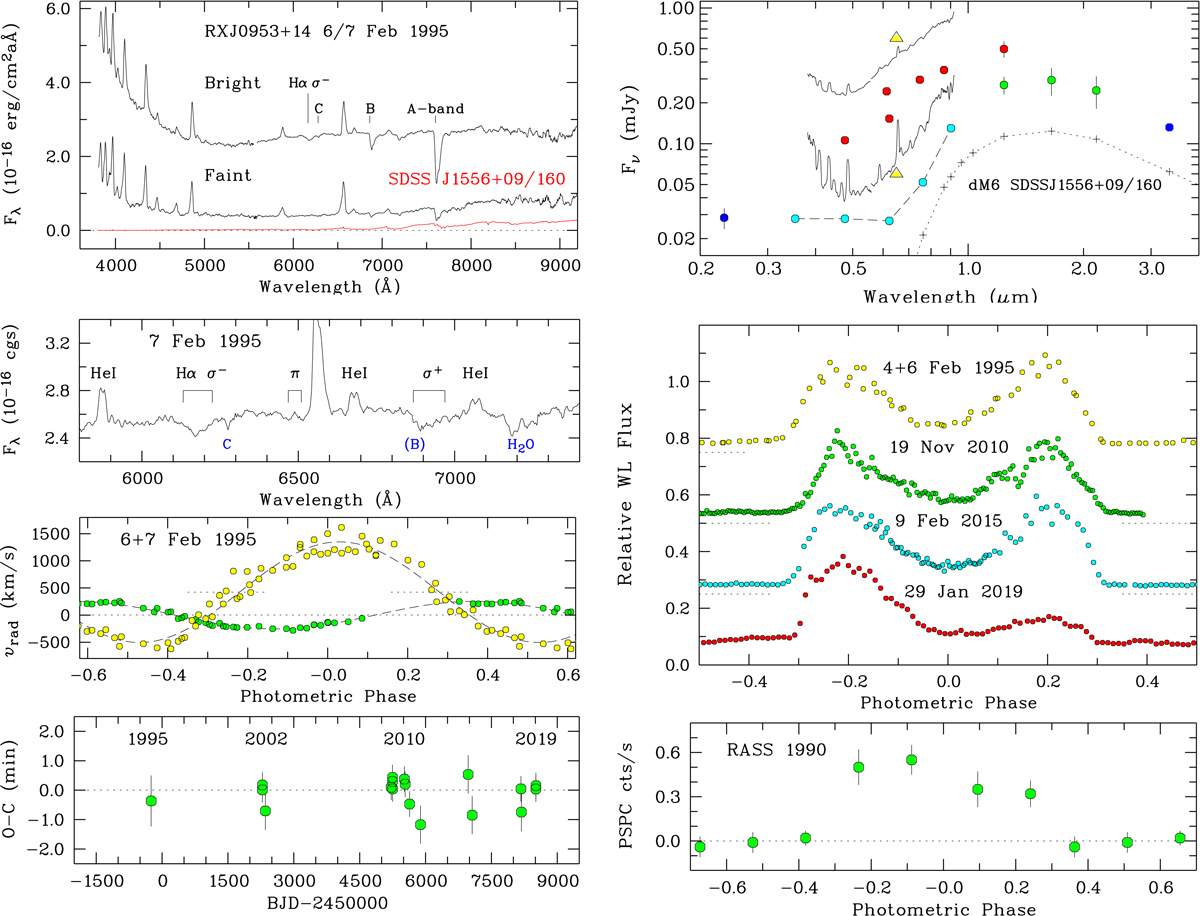
RX J0953.1+1458. Left, top: combined blue and red flux-calibrated medium-resolution spectra at orbital maximum and minimum. Second from top: zoom into a difference spectrum emphasizing the Hα Zeeman features. Third from top: mean radial-velocity curves of the narrow and broad emission-line components of Hα. Bottom: O − C diagram for the center of the bright phase of the optical light curves. Right, top: overall spectral energy distribution, involving nonsimultaneous data (see text). Center: optical light curves taken in WL, taken in 1995, 2010, 2015, and 2019, shifted by multiples of 0.25 units in the ordinate. Bottom: PSPC X-ray light curve taken in the RASS. The photometric phase is from Eq. (7).
Current usage metrics show cumulative count of Article Views (full-text article views including HTML views, PDF and ePub downloads, according to the available data) and Abstracts Views on Vision4Press platform.
Data correspond to usage on the plateform after 2015. The current usage metrics is available 48-96 hours after online publication and is updated daily on week days.
Initial download of the metrics may take a while.