Fig. 6.
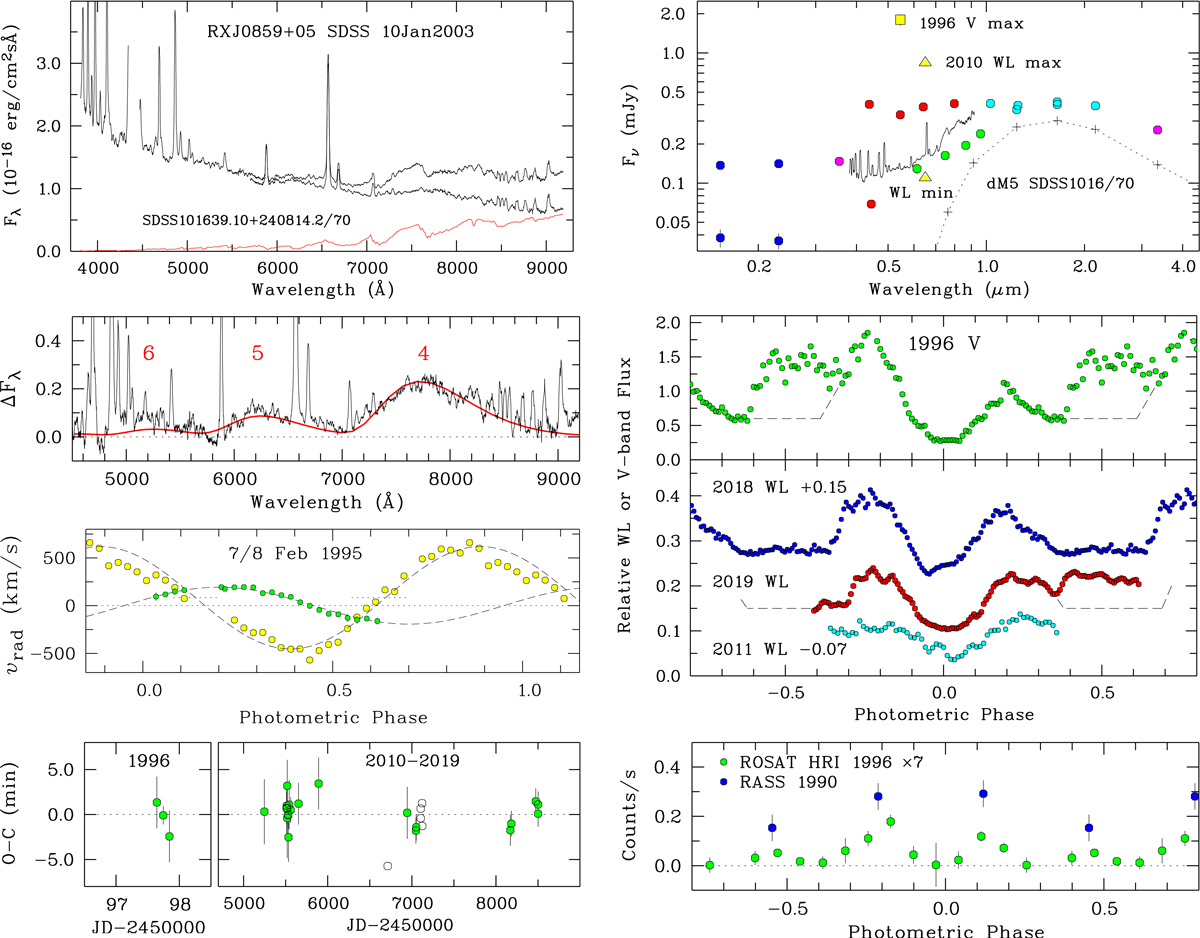
RX J0859.1+0537. Left, top: SDSS spectra of RX J0859+05 (black curve) and the dM5 star SDSS J101639.10+240814.2 divided by 70 to match the TiO structures in the polar spectrum (red). The difference spectrum (black) shows faint cyclotron lines. Second from top: model cyclotron spectrum (red) fit to the observed difference spectrum (black). Third from top: mean radial-velocity curves of the NEL (green) and the combined BBC and HCV components (yellow) of Hβ, Hγ, and He IIλ4686, measured from the high- and medium-resolution trailed spectra. Bottom: O − C diagram for the times of the primary minimum. Green dots show this work, and open circles show results from Joshi et al. (2020) (see text). Right, top: overall spectral energy distribution, built from nonsimultaneous data (see text). Center panels: V-band light curve of 15 January 1996 and WL light curves of on 4 March 2018, 17 January 2019, and 1 April 2011. The dashed lines schematically separate the emissions of the primary and the secondary pole. Bottom panel: Rosat X-ray light curves taken 1990 with the PSPC and 1996 with the HRI. Phases are from Eq. (6).
Current usage metrics show cumulative count of Article Views (full-text article views including HTML views, PDF and ePub downloads, according to the available data) and Abstracts Views on Vision4Press platform.
Data correspond to usage on the plateform after 2015. The current usage metrics is available 48-96 hours after online publication and is updated daily on week days.
Initial download of the metrics may take a while.