Fig. 5.
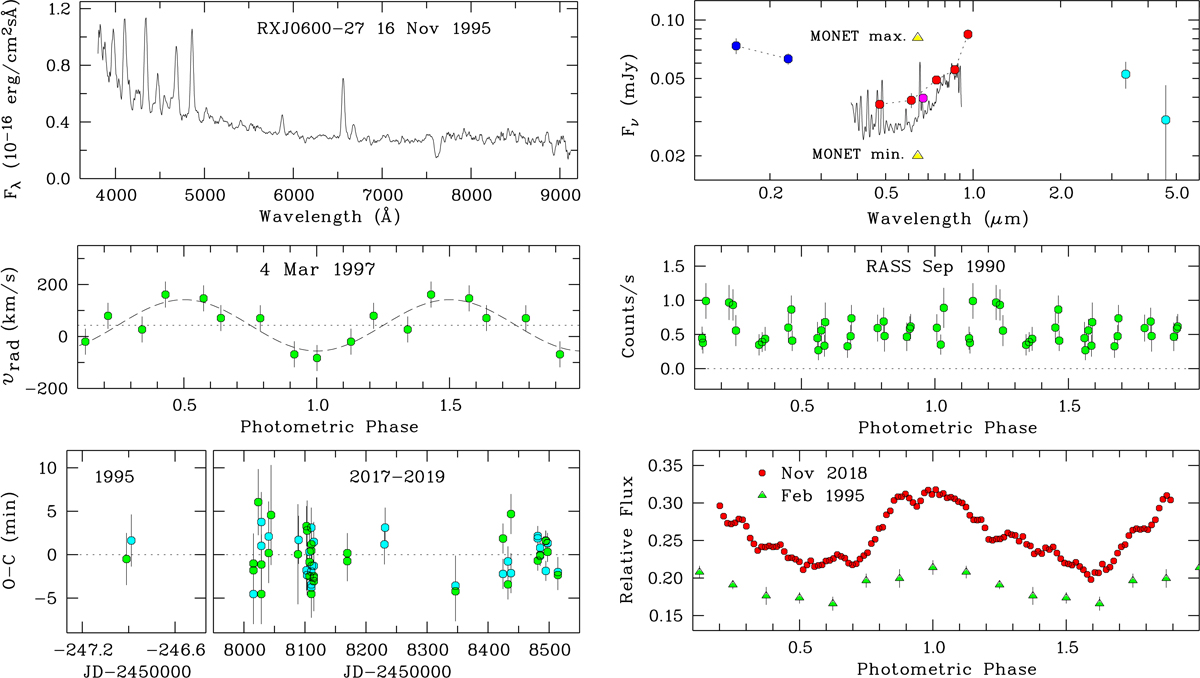
RX J0600.5–2709. Left, top: identification spectrum taken on 16 November 1995. Left, center: Balmer line radial-velocity curve from phase-resolved spectroscopy on 4 March 1997. Left, bottom: O − C diagram for orbital maxima (green) and minima (cyan). Right, top: spectral energy distribution, showing the identification spectrum, and a summary of nonsimultaneous photometry (see text). Right, center: X-ray light curve taken in the RASS between 10 and 13 September 1990. Right, bottom: light curves taken in WL on 5 February 1995 and 28 December 2018. The photometric phase is from Eq. (5).
Current usage metrics show cumulative count of Article Views (full-text article views including HTML views, PDF and ePub downloads, according to the available data) and Abstracts Views on Vision4Press platform.
Data correspond to usage on the plateform after 2015. The current usage metrics is available 48-96 hours after online publication and is updated daily on week days.
Initial download of the metrics may take a while.