Fig. 4.
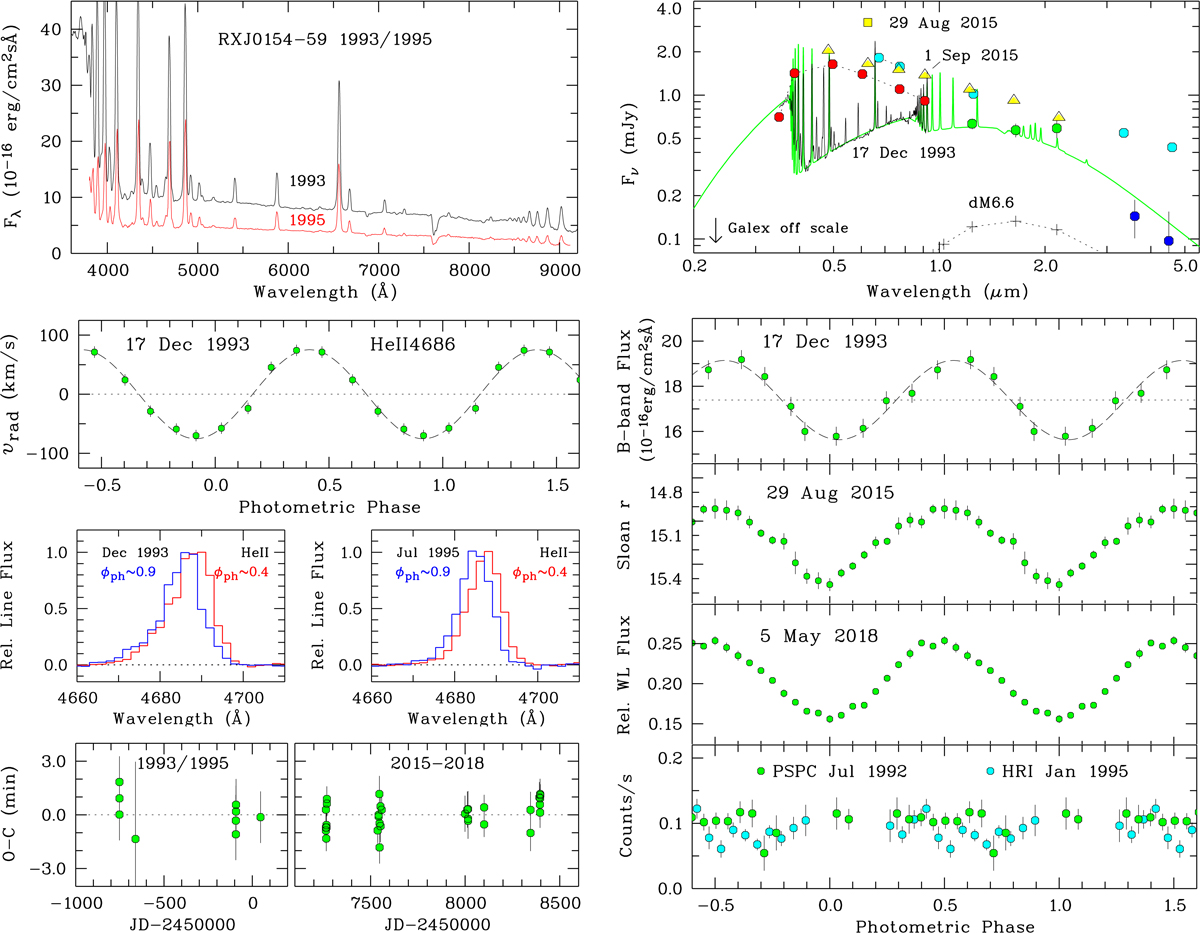
RX J0154.0–5947. Left, top: mean spectra of the observations on 23 August 1993 and 24 November 1995. Second from top: He IIλ4686 radial velocities obtained from the 17 December 1993 spectrophotometry with fitted sinusoid superimposed. Third from top: He IIλ4686 line profiles at maximum blueshift (blue curve) and redshift (red curve). Bottom: O − C diagram for the times of orbital minimum. Right, top: overall spectral energy distribution (see text). Bottom set of four panels: spectral flux in the B band of 17 December 1993 with peak magnitude B = 16.3, Sloan r light curve of 29 August 2015 with peak brightness r = 14.9, WL relative flux on 5 May 2018, reaching magnitude w = 15.2, and ROSAT X-ray light curves taken with the PSPC in the intermediate state of 1−2 July 1992 and with the HRI in the high state of 3−7 January 1995. All light curves are phased on the ephemeris of Eq. (4).
Current usage metrics show cumulative count of Article Views (full-text article views including HTML views, PDF and ePub downloads, according to the available data) and Abstracts Views on Vision4Press platform.
Data correspond to usage on the plateform after 2015. The current usage metrics is available 48-96 hours after online publication and is updated daily on week days.
Initial download of the metrics may take a while.