Fig. 9
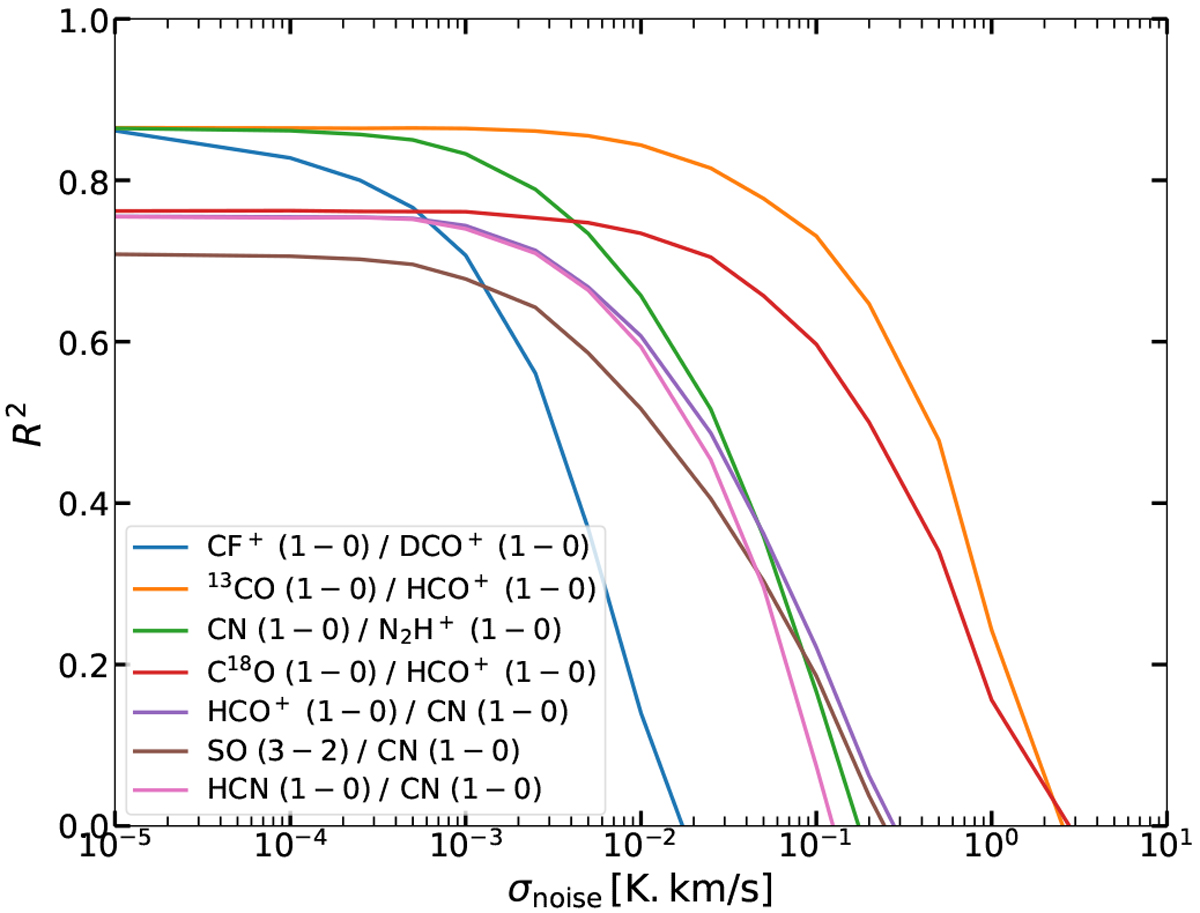
Evolution of the R2 performance of the Random Forest predictors (for cold dense gas) when adding noise of constant variance ![]() to the line intensities, as a function of the noise level σnoise, for the 3 best tracers for cold dense medium (first three curves) and for the four tracers least affected by the noise (next four curves).
to the line intensities, as a function of the noise level σnoise, for the 3 best tracers for cold dense medium (first three curves) and for the four tracers least affected by the noise (next four curves).
Current usage metrics show cumulative count of Article Views (full-text article views including HTML views, PDF and ePub downloads, according to the available data) and Abstracts Views on Vision4Press platform.
Data correspond to usage on the plateform after 2015. The current usage metrics is available 48-96 hours after online publication and is updated daily on week days.
Initial download of the metrics may take a while.