Fig. 6
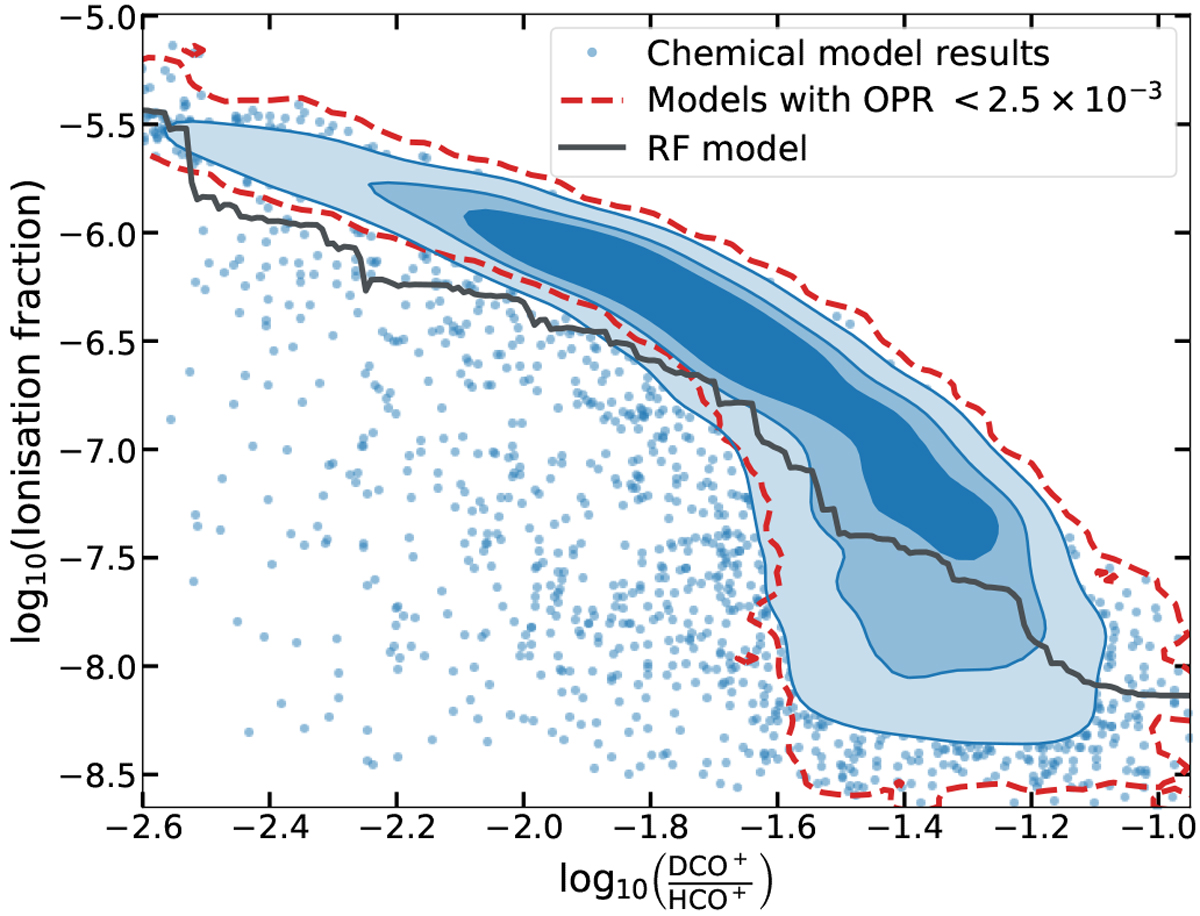
DCO+ over HCO+ column density ratio in our grid of dense cold gas models (blue points and contours), shown as a scatter plot, with the central crowded regions replaced by PDF isocontours containing 25, 50, and 75% of the points. Our best fit Random Forest model is shown as a black line. The red dashed contours shows the distributions of the models with OPR![]() .
.
Current usage metrics show cumulative count of Article Views (full-text article views including HTML views, PDF and ePub downloads, according to the available data) and Abstracts Views on Vision4Press platform.
Data correspond to usage on the plateform after 2015. The current usage metrics is available 48-96 hours after online publication and is updated daily on week days.
Initial download of the metrics may take a while.