Fig. 5
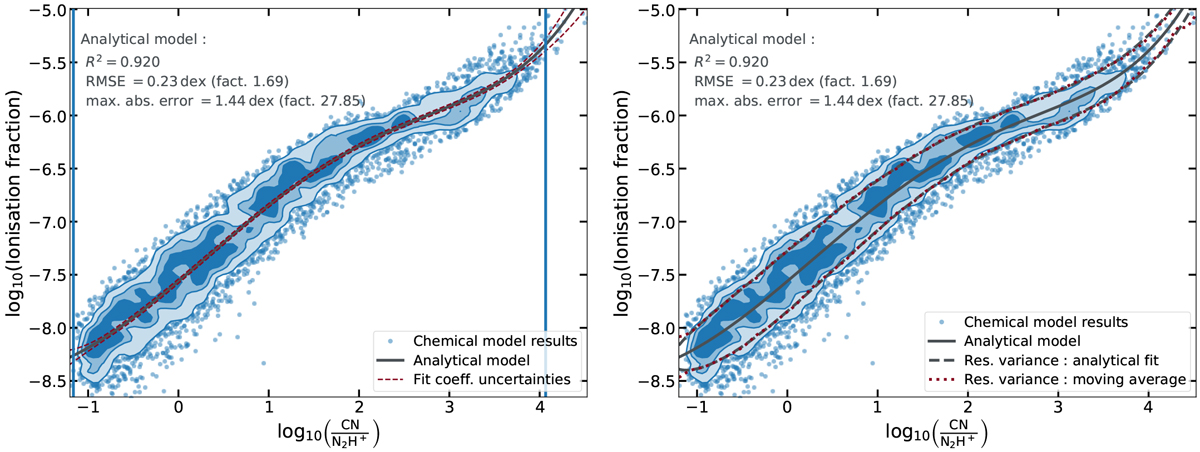
Illustration of the two sources of uncertainties for the best column density ratio for tracing the ionization fraction in dense cold medium, CN/N2H+. Left panel: analytical fit (solid black line), the standard deviation around this curve corresponding to the uncertainties on the fit coefficients (thin dashed red lines representing the 3σ level), and the bounds of the validity range defined in the text (vertical blue lines). Right panel: analytical fit (solid black line) and two estimates of the standard deviation corresponding to the residual scatter of the data points around the curve: the red dotted line presents a moving-average estimate of the local standard deviation, and the dashed black lines shows our analytical fit of the residual standard deviation. On both panels, the chemical model grid is shown as a scatter plot, with the central crowded regions replaced by PDF isocontours containing 25, 50, and 75% of the points.
Current usage metrics show cumulative count of Article Views (full-text article views including HTML views, PDF and ePub downloads, according to the available data) and Abstracts Views on Vision4Press platform.
Data correspond to usage on the plateform after 2015. The current usage metrics is available 48-96 hours after online publication and is updated daily on week days.
Initial download of the metrics may take a while.