Fig. 3
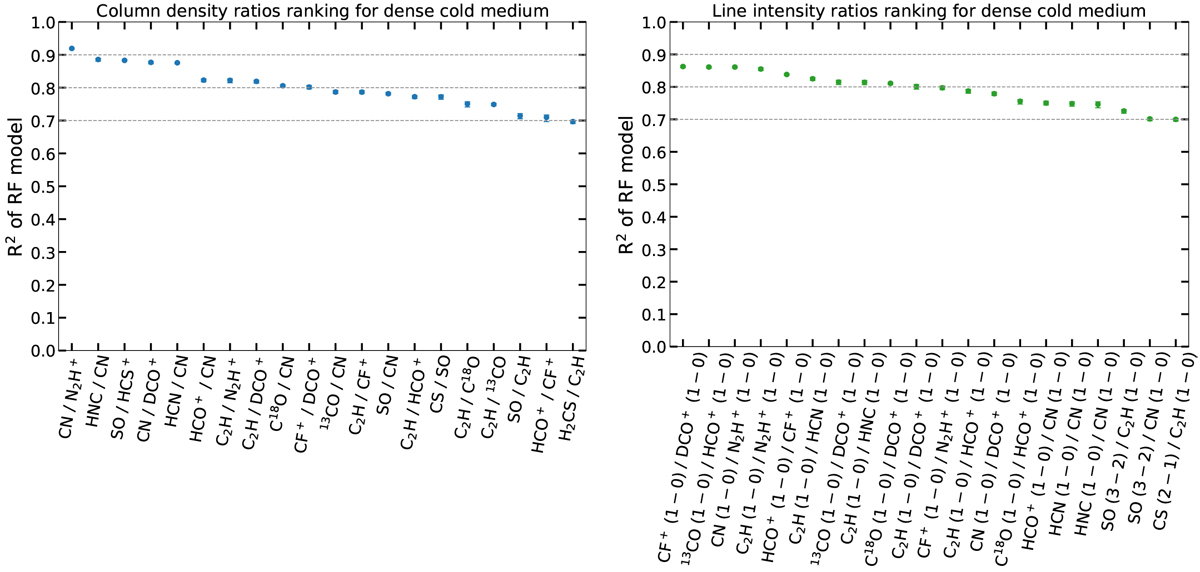
Ranking of column density ratios (left) or line intensity ratios (right) of observable tracers by order of the predictive power for predicting the ionization fraction (measured by the R2 coefficient), in the case of dense cold medium conditions (showing only the first 20). Errorbars of the R2 estimates are computed by cross-validation (see text for explanations).
Current usage metrics show cumulative count of Article Views (full-text article views including HTML views, PDF and ePub downloads, according to the available data) and Abstracts Views on Vision4Press platform.
Data correspond to usage on the plateform after 2015. The current usage metrics is available 48-96 hours after online publication and is updated daily on week days.
Initial download of the metrics may take a while.