Fig. 2
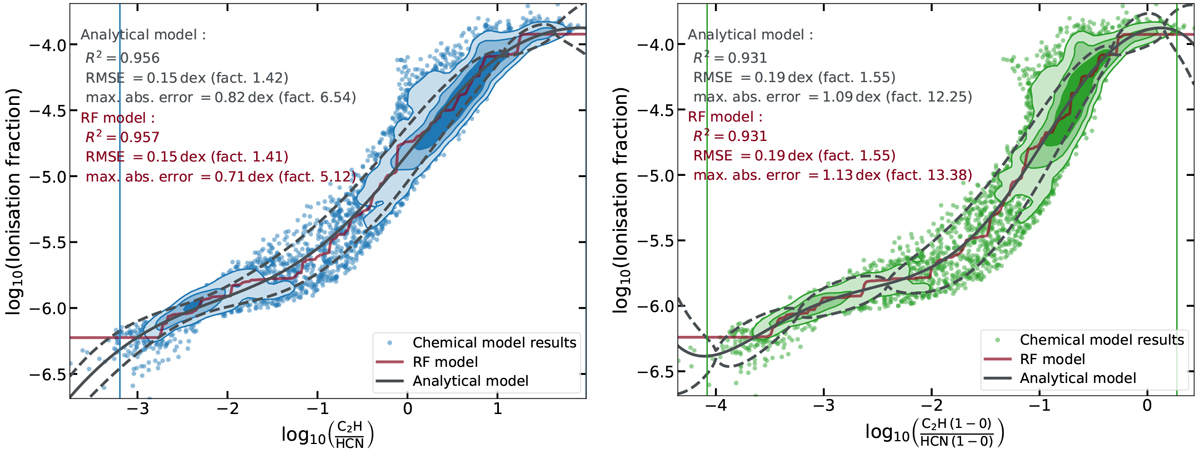
Ionization fraction versus the best column density ratio, C2H/HCN (left panel), and the best line intensity ratio, C2H (1–0) / HCN (1–0) (right panel) for tracing the ionization fraction in translucent medium conditions. The model grid is shown as a scatter plot, with the central crowded regions replaced by PDF isocontours containing 25, 50, and 75% of the points. Superimposed are the RF model (red line), the analytical fit (solid black line, presented in Sect. 5), the analytical fit of the 1σ uncertainty (dashed black lines, presented in Sect. 5), and the bounds of the validity range of the analytical fit (vertical lines, presented in Sect. 5). The quality estimates of the two models are indicated on the figure.
Current usage metrics show cumulative count of Article Views (full-text article views including HTML views, PDF and ePub downloads, according to the available data) and Abstracts Views on Vision4Press platform.
Data correspond to usage on the plateform after 2015. The current usage metrics is available 48-96 hours after online publication and is updated daily on week days.
Initial download of the metrics may take a while.