Fig. A.1
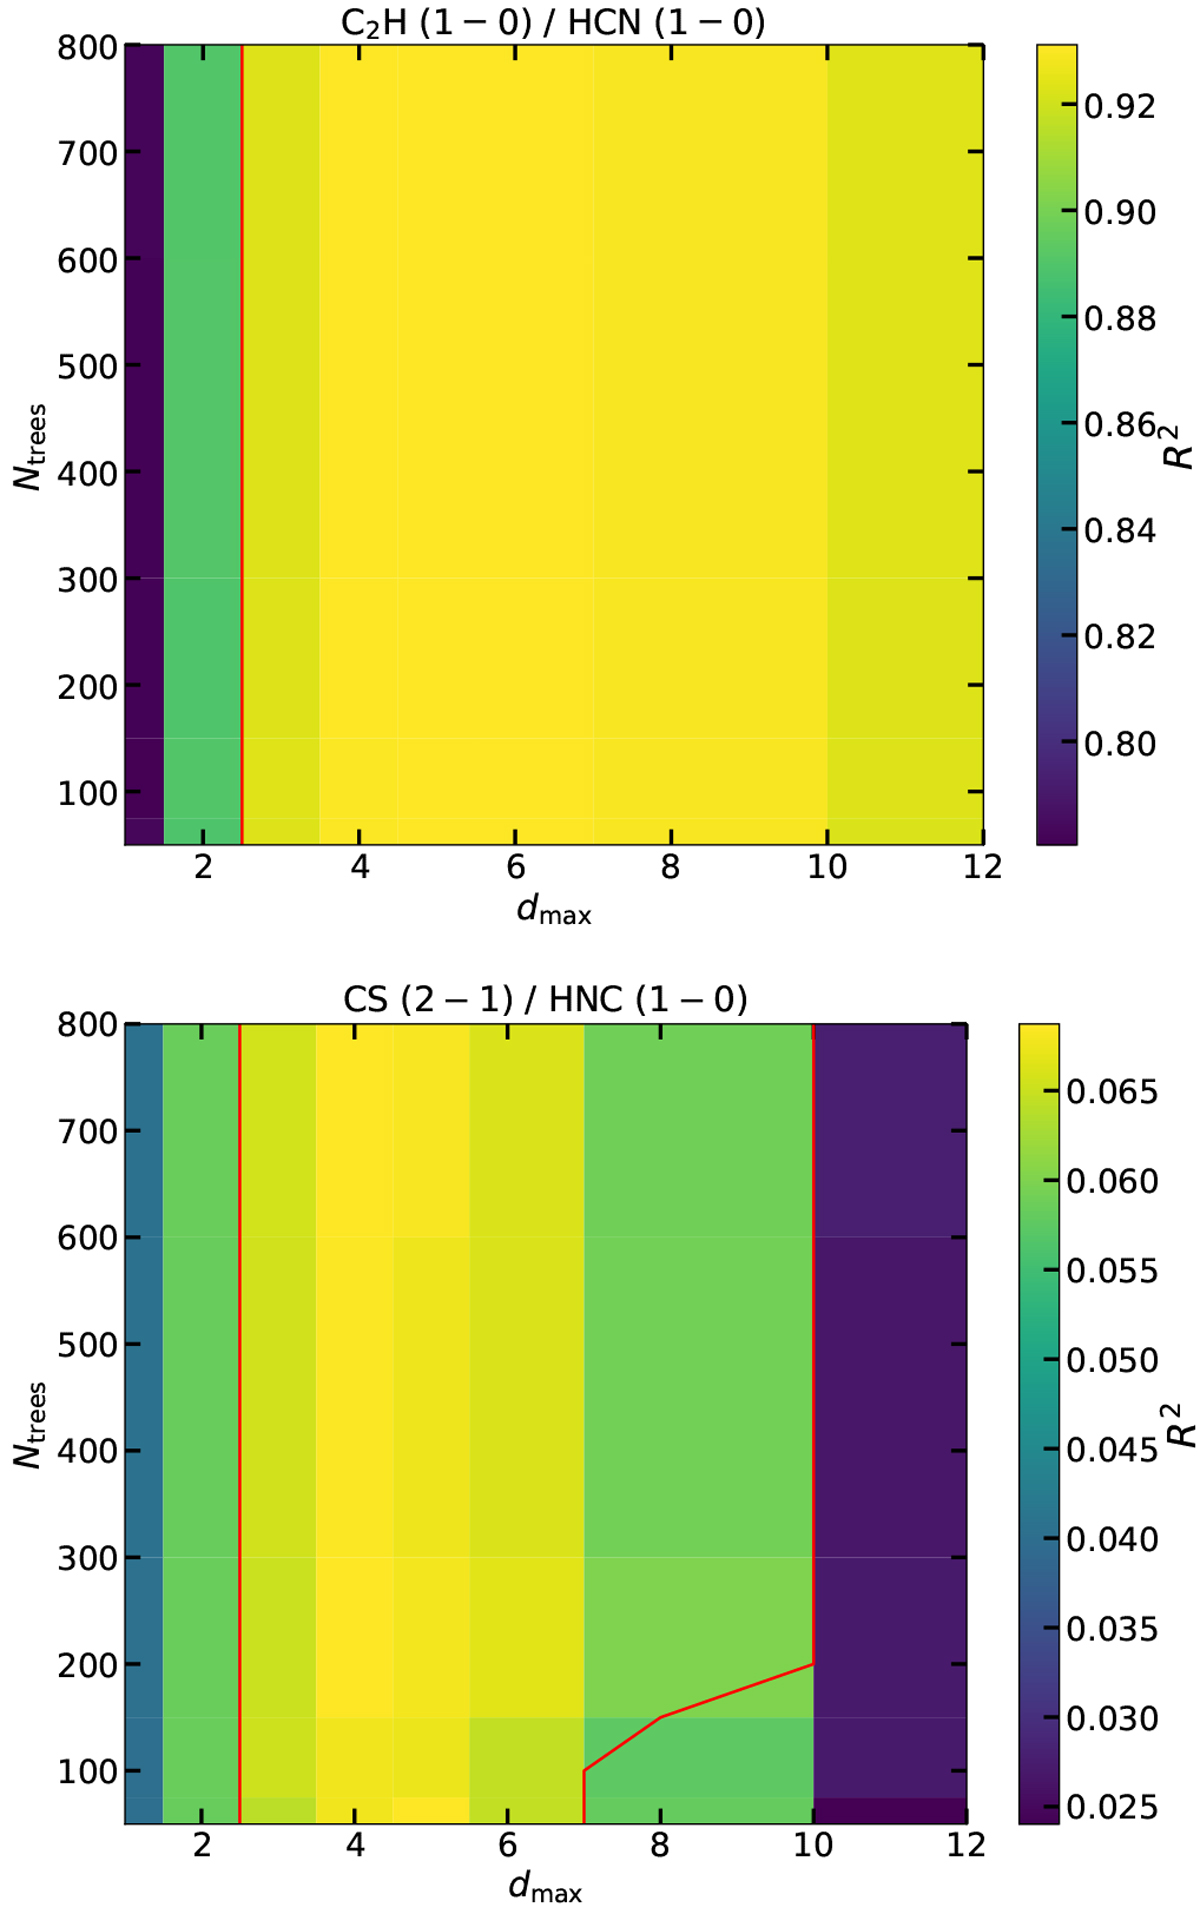
R2 (OOB value) as a function of the tuning parameters of the Random Forest (Ntrees and dmax), for thepreliminary best (top panel) and worst (bottom panel) ratios found though a preliminary estimate using defaults values of the parameters, for line integrated intensity ratios and translucent medium conditions. The red contours show the region where the R2 value is within 0.01 of the maximum.
Current usage metrics show cumulative count of Article Views (full-text article views including HTML views, PDF and ePub downloads, according to the available data) and Abstracts Views on Vision4Press platform.
Data correspond to usage on the plateform after 2015. The current usage metrics is available 48-96 hours after online publication and is updated daily on week days.
Initial download of the metrics may take a while.