Fig. 9
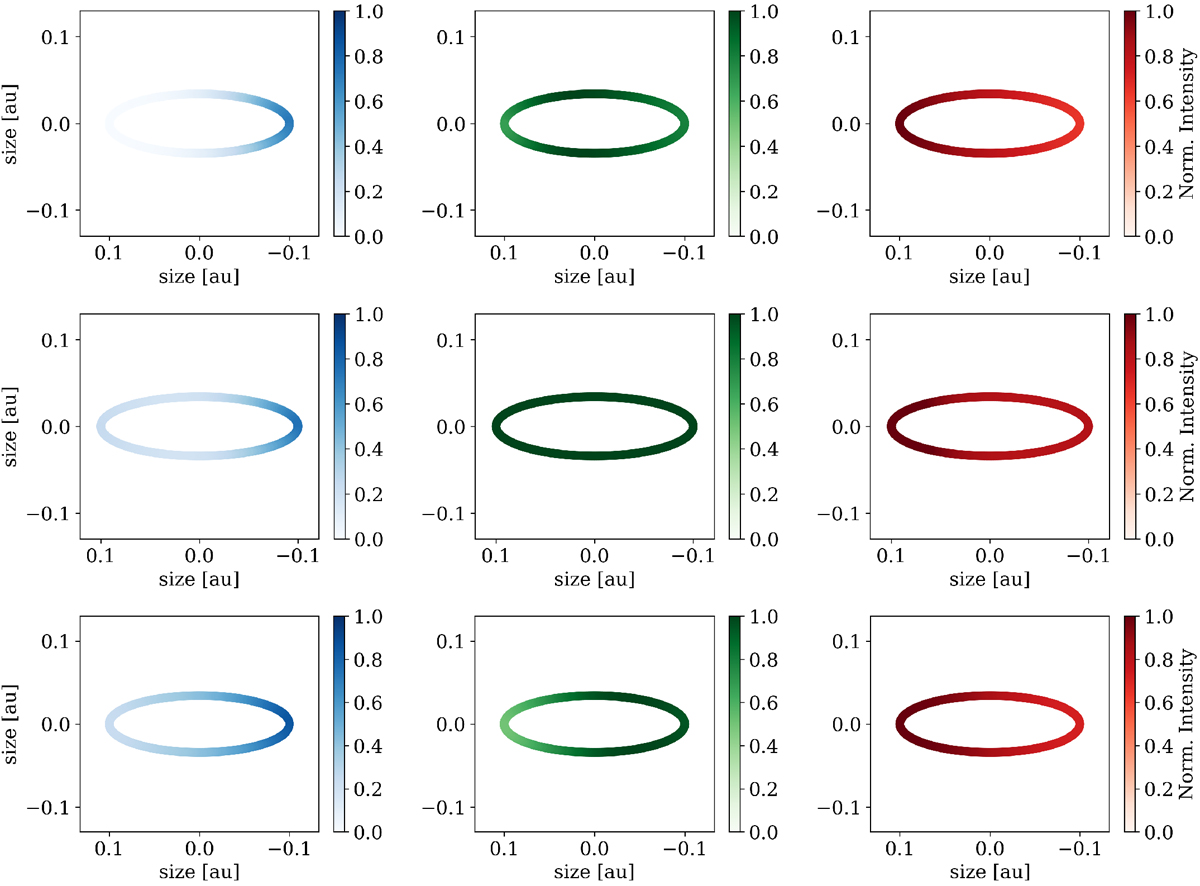
Model-predicted intensity maps of the blue-shifted (average over spectral channels at 2.2925, 2.3213, and 2.3516 μm), peak (average over spectral channels at 2.2945, 2.3237, and 2.3529 μm), and red-shifted (average over spectral channels at 2.2954, 2.3246, and 2.3543 μm) line components of the first (top panel), second (middle panel) and third (bottom) bandheads. Maps are normalised to the peak intensity and are displayed for an inclination of 70°, and a radius of 0.1 au. The physical parameters of the model are the same as in Fig. 8.
Current usage metrics show cumulative count of Article Views (full-text article views including HTML views, PDF and ePub downloads, according to the available data) and Abstracts Views on Vision4Press platform.
Data correspond to usage on the plateform after 2015. The current usage metrics is available 48-96 hours after online publication and is updated daily on week days.
Initial download of the metrics may take a while.