Fig. 3
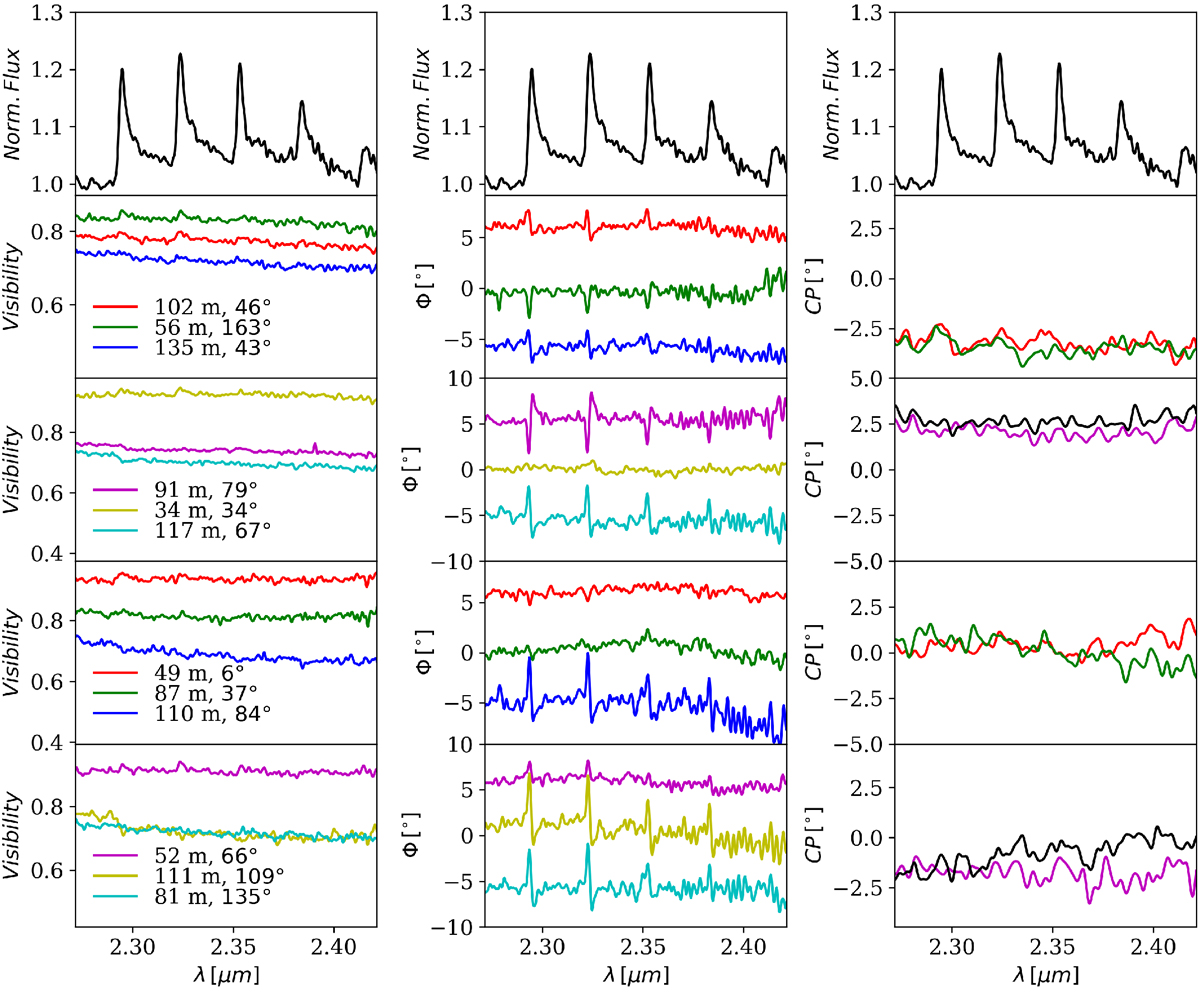
GRAVITY interferometric data for May and August 2017. Top panels: CO spectrum of the May dataset, normalised to the continuum. Visibilities, differential phases, and closure phases are displayed in the left, middle, and right panels, respectively. The differential phases are shifted by ± 5° for clarity and are in units of degrees. Closure phases are in units of degrees. The data are smoothed to a resolution of R = 2000.
Current usage metrics show cumulative count of Article Views (full-text article views including HTML views, PDF and ePub downloads, according to the available data) and Abstracts Views on Vision4Press platform.
Data correspond to usage on the plateform after 2015. The current usage metrics is available 48-96 hours after online publication and is updated daily on week days.
Initial download of the metrics may take a while.