Open Access
Fig. B.7
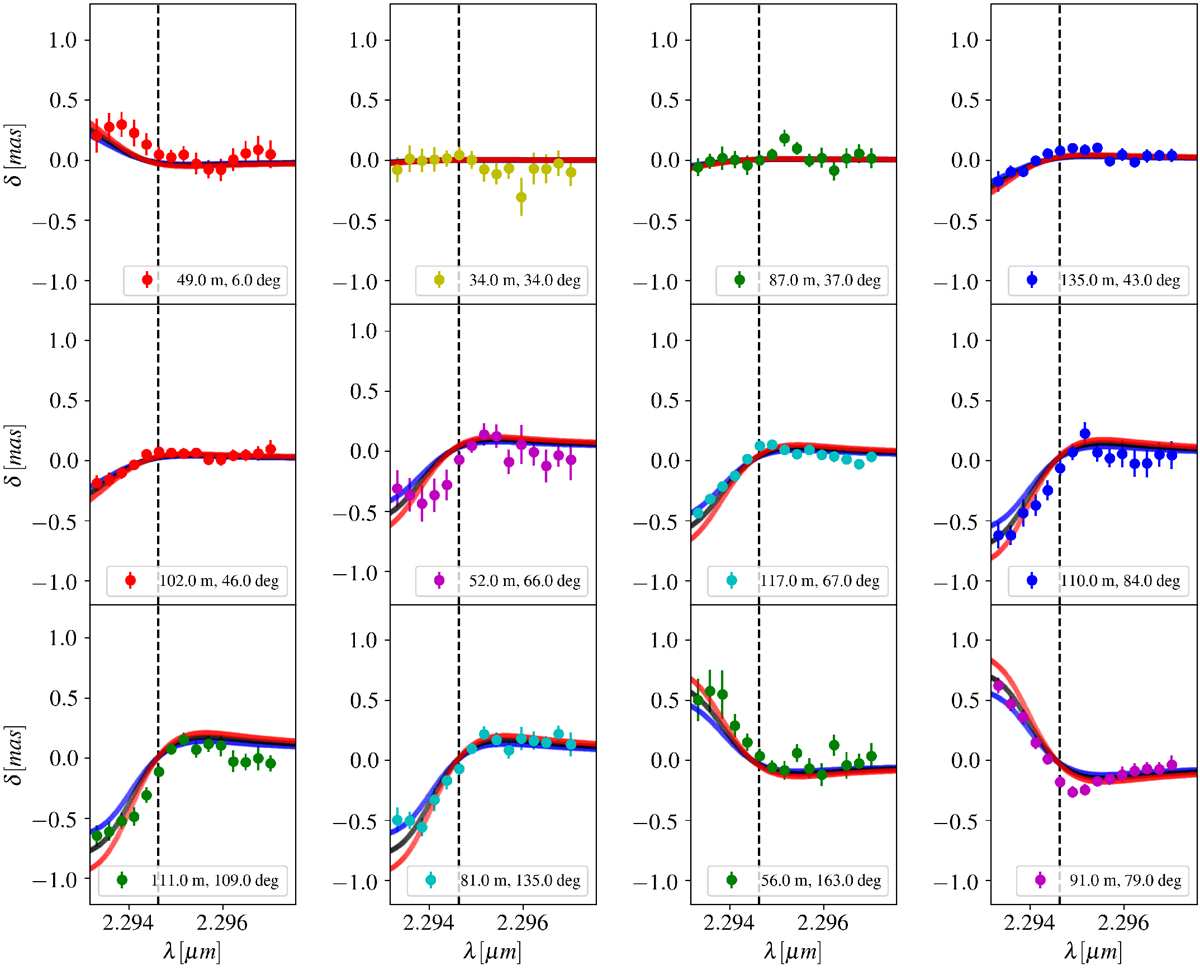
Comparison between observed displacements (coloured dots with error bars) of the first bandhead and the predictions from ring models at R = 4000, i = 70°, and radius 0.08 au (solid blue line), 0.1 au (solid black line) and 0.12 au (solid red line).
Current usage metrics show cumulative count of Article Views (full-text article views including HTML views, PDF and ePub downloads, according to the available data) and Abstracts Views on Vision4Press platform.
Data correspond to usage on the plateform after 2015. The current usage metrics is available 48-96 hours after online publication and is updated daily on week days.
Initial download of the metrics may take a while.