Fig. A.9
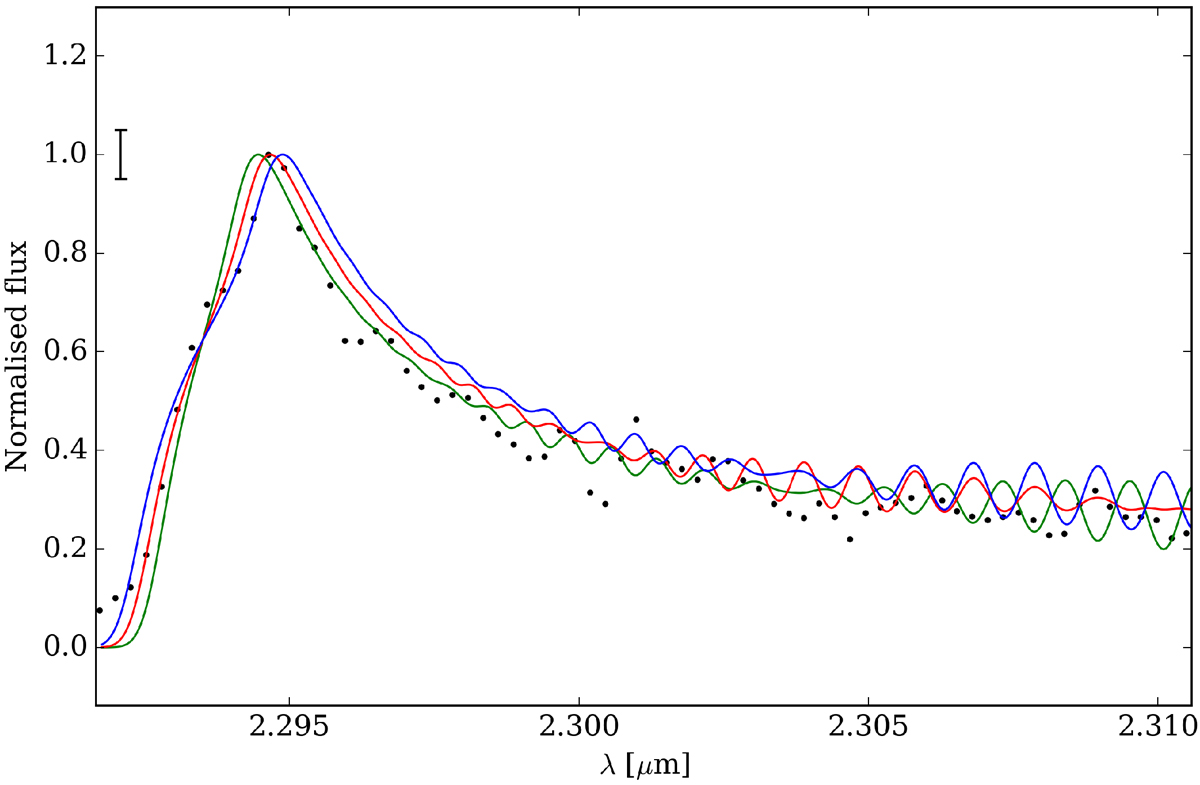
Continuum-subtracted first CO bandhead of 51 Oph normalised to the peak intensity (black dots). Coloured lines shown models with fixed values of T = 2400 K, NCO = 4 × 1021 cm−2, Δv = 15 km s−1 and vrot sini values of 100 km s−1 (solid green line), 130 km s−1 (solid red line), and 160 km s−1 (solid blue line). The black vertical line in the top left corner of the peak of the bandhead has a lengths of twice the rms value measured atthe continuum.
Current usage metrics show cumulative count of Article Views (full-text article views including HTML views, PDF and ePub downloads, according to the available data) and Abstracts Views on Vision4Press platform.
Data correspond to usage on the plateform after 2015. The current usage metrics is available 48-96 hours after online publication and is updated daily on week days.
Initial download of the metrics may take a while.